


Abstract
Purpose
As digital technologies become increasingly embedded in daily life, evidence remains limited regarding how smartphone use relates to occupational participation among community-dwelling older adults. This study examined the association between smartphone application diversity and occupational participation in later life.
Methods
This cross-sectional study used health checkup data collected during 2024–2025. Occupational participation was assessed using the Self-Completed Occupational Performance Index (SOPI), which covers leisure, productivity, and self-care domains. Participants were classified into high application diversity (HAD) and low application diversity (LAD) groups based on the number of 12 smartphone applications used daily. Group differences were tested, and adjusted regression models with bootstrap resampling were used to assess independent associations and robustness.
Results
Among 97 participants, 67 were classified into the HAD group and 30 into the LAD group. Participants with HAD had higher total SOPI scores than those with LAD. In domain-specific analyses, application diversity was independently associated only with productivity-related occupational participation (adjusted β = 2.17, 95% CI: 0.49–3.86), and this association was supported by bootstrap results.
Conclusions
Greater diversity in smartphone application use was associated with more favorable engagement in productivity-related occupations among community-dwelling older adults. These findings suggest that application diversity may be a meaningful indicator of how digital technologies are integrated into productive roles and responsibilities in later life.
Introduction
Population aging is accelerating worldwide, making the promotion of health, participation, and well-being among community-dwelling older adults a key public health and rehabilitation priority [1]. Along with demographic shifts, rapid digitalization has transformed daily life by positioning smartphones as essential tools for communication, information access, health management, and social participation. Smartphone adoption among older adults has increased substantially in developed countries. In Japan, 2023 national surveys reported that over 70% of adults aged 65 years own smartphone [2]. Similarly, survey data from Korea show that more than three-quarters of adults aged 60 years and older are smartphone owners [3]. In addition, reports from Europe indicate that smartphone use among older adults has become common in multiple high-income countries, with approximately 63–75% of adults aged 55–74 years [4]. These findings are consistent with a systematic review reporting that smartphone ownership among older adults in the United States exceeded 60% in 2021 [5]. This convergence of population aging and mobile technology expansion underscores the growing importance of understanding how smartphone use relates to health and occupational participation in later life.
Despite this rapid diffusion, ownership does not necessarily equate to effective or purposeful use. Previous studies have often operationalized smartphone use using binary indicators (e.g., users vs. non-users) or crude measures, such as frequency or duration of use [6]. However, these approaches may obscure heterogeneity in how older adults engage with smartphones in their daily lives. Evidence suggests that many older adults primarily use a limited set of basic applications (e.g., phone calls or text messaging), whereas more advanced or functionally supportive applications remain underutilized [7]. One approach to characterizing smartphone use is to consider the diversity of applications used in daily life rather than ownership or total screen time alone. Recent research has similarly conceptualized smartphone app usage diversity as the breadth of engagement across different application functions and demonstrated that its association with quality of life may vary according to age and digital literacy [8]. In the present study, application diversity refers simply to the number of different smartphone applications used in daily life and is used as an operational indicator of the breadth of digital engagement. It is not intended as a validated psychometric measure or a newly developed scale. Rather, this behavioral measure allows us to examine whether broader use of smartphone functions is associated with participation in everyday occupations. Previous research has shown that patterns of application use are associated with individual characteristics, including cognitive ability, supporting the potential relevance of application-use patterns when examining digital engagement in older adults [9].
From an occupational therapy perspective, digital technologies, such as smartphones, can be conceptualized as tools that enable and mediate occupational participation by supporting the performance of everyday activities. A scoping review of the digitalization of activities of daily living highlighted that everyday technologies, including everyday information and communication technologies, can function as both facilitators and barriers to older adults’ occupations [10]. This dual role of technology aligns with occupational therapy frameworks that conceptualize participation as an outcome shaped by person–environment–occupation interactions [11]. In older adults, occupational participation, defined as engagement in meaningful activities across leisure, productivity, and self-care domains, is particularly important for maintaining physical, cognitive, and psychological health, as well as for sustaining independence and quality of life [12, 13]. The Canadian model of occupational performance and engagement (CMOP-E) [14] emphasizes that health is shaped not only by the types of occupations performed but also by perceived occupational control, balance, and satisfaction in daily activities. Within this framework, the diversity of smartphone application use may reflect an individual’s ability to flexibly select and integrate digital tools across multiple occupational contexts, thereby supporting the key CMOP-E constructs. However, empirical evidence directly linking everyday digital behaviors, specifically patterns of smartphone application use, to occupational participation among older adults remains limited.
Therefore, this study aimed to examine the association between daily smartphone application diversity and occupational participation among community-dwelling older adults. We hypothesized that individuals who use a greater variety of smartphone applications in their daily lives would demonstrate higher levels of occupational participation across the leisure, productivity, and self-care domains. By focusing on application diversity as a behavioral indicator of everyday digital engagement, this study seeks to inform contemporary approaches to support occupational participation among older adults by clarifying how real-world smartphone use is linked to meaningful occupational participation in later life, with potential implications for digital inclusion strategies and community-based interventions for older adults in a digitalized society.
Material and Methods
Research Design
This cross-sectional study used data from the 2024 and 2025 assessment waves of the Widely Hokkaido Individual Training for Elderly (WHITE) Study, a community-based health check-up program targeting community-dwelling older adults in ANONYMIZED FOR REVIEW. The WHITE Study comprises questionnaire-based assessments and objective measurements of physical and cognitive functions conducted annually.
Participants
In total, 158 individuals participated in the 2024 and 2025 surveys. Participants were excluded if they (i) did not use a smartphone (n = 33), (ii) had cognitive impairment defined as a mini-mental state examination (MMSE) score < 23 (n = 8), (iii) had a history of neurological or psychiatric disorders, including stroke, depression, Alzheimer’s disease, or Parkinson’s disease (n = 4), (iv) had been certified as requiring long-term care under the Japanese public long-term care insurance system (n = 6), or (v) had missing data in key study variables (n = 10). After applying these exclusion criteria, 97 community-dwelling older adults who used smartphones in their daily lives were included in the final analysis. A flowchart summarizing the study is depicted in Fig. 1. All participants provided written informed consent and the WHITE Study protocol was approved by ANONYMIZED FOR REVIEW.
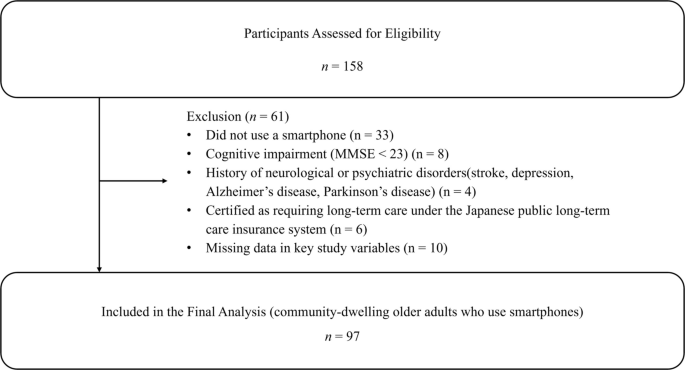
Study Flowchart. MMSE, mini-mental state examination
Assessment of Smartphone Application Diversity
Participants were asked to indicate whether they used each smartphone application on a daily basis (yes/no) using a predefined list of commonly used applications. The list included phone calls, email, camera, quick response (QR) code use, web browsing, video streaming, healthcare-related applications, pedometer, text messaging, Facebook, X (formerly Twitter), and others. The “Other” category was coded as “used” if participants reported use of any smartphone application not included in the predefined list. For each participant, the number of applications reported was summed to generate a smartphone application diversity score, with higher scores indicating greater diversity of application use.
In this study, smartphone application diversity was operationalized as the number of different smartphone applications used, reflecting the breadth of digital engagement rather than the frequency or duration of use. Participants were categorized into two groups based on their application count: low application diversity (fewer than five applications; LAD) and high application diversity (five or more applications; HAD). The thresholds for the five applications were determined based on both empirical distribution within the present sample and prior population-level evidence.
Prior survey data from the United States showed that approximately 50% of older adults use three smartphone applications, with usage clustering of around five to six applications among approximately 40% of older smartphone users [15]. Based on this distribution, we adopted the use of five applications as a threshold to represent the greater diversity in smartphone application use among older adults. Therefore, a cutoff of five applications was considered a reasonable indicator of diverse and multifunctional smartphone use. In the current study, the median number of smartphone applications used was also five, which is consistent with the threshold derived from prior survey data. This concordance supports the appropriateness of using five applications as a cutoff to represent application-use diversity in the present study.
Assessment of Occupational Participation
Occupational participation was assessed using the self-completed occupational performance index (SOPI) [16], a self-administered questionnaire based on the CMOP-E. The SOPI evaluates participation in meaningful occupations across the leisure, productivity, and self-care domains. Each domain assessed the perceived occupational control, occupational balance, and satisfaction with performance. Occupational control refers to the extent to which individuals feel able to decide when and how to engage in the occupation. Occupational balance reflects whether individuals perceive that they can allocate sufficient time and energy to the occupation within their daily lives. Satisfaction with performance captures the individual’s subjective appraisal of how satisfactorily they are able to perform the occupation. Each item is rated on a 5-point Likert scale. Each occupational domain comprises three items, yielding a domain score ranging from 3 to 15. The raw total score across the nine items ranges from 9 to 45 and can be standardized to a 0–100 scale using the formula (raw total score − 9)/36 × 100. In the present study, the standardized 0–100 score was used for the overall SOPI score, whereas the raw domain scores (range, 3–15) were used for the leisure, productivity, and self-care domains. Higher scores indicate more favorable occupational participation. In the original validation study, the SOPI showed good internal consistency, with a Cronbach’s α of 0.93, and moderate correlations among the three occupational categories (r = 0.50–0.64) [16]. In the present study, total SOPI scores and domain-specific scores for leisure, productivity, and self-care were used as outcome variables.
Covariates
The demographic characteristics included age, sex, educational attainment, living arrangements, medication use, and employment status. Educational attainment was assessed by highest completed level (junior high school, high school, vocational school/junior college, or university/graduate school) and dichotomized as ≤ 12 or ≥ 13 years of education. Living arrangements were coded as living alone or with others, and medication use was recorded as a binary variable (yes/no). Employment status was categorized as remunerative work, volunteer work, or unemployed.
The smartphone-related variables included years of smartphone use and frequency of daily smartphone use. Participants were first asked whether they currently owned a smartphone, and only those who reported smartphone ownership were asked to indicate the number of years they had used a smartphone. No specific technical definition of a smartphone was provided in the questionnaire, and smartphone ownership was based on participants’ self-report. Reported duration of smartphone use ranged from 1 to 18 years, and no values were considered implausible or excluded on the basis of duration. Daily smartphone use frequency was assessed using a nine-category scale ranging from “almost never” to “ ≥ 5 h per day” and subsequently dichotomized as < 1 h or ≥ 1 h per day, consistent with prior studies examining smartphone or digital device use intensity among older adults [17, 18].
Physical and cognitive functions were assessed using established and widely used measures. Gait speed was assessed using the 10-m walk test. Participants were instructed to walk at their usual comfortable pace, and gait speed was calculated as the distance walked (10 m) divided by the time required to complete the test and expressed in meters per second (m/s) [19]. Gait speed is a validated indicator of physical function and mobility in older adults and has been associated with functional independence and participation in daily activities [20]. Cognitive function was assessed using the MMSE [21], a standard screening tool for global cognitive status. Functional decline was evaluated using the Kihon checklist (KCL) [22], a comprehensive screening instrument commonly used in Japan to assess frailty-related domains, including physical, cognitive, and social functioning. Depressive symptoms were assessed using the 15-item geriatric depression scale (GDS-15) [23], a validated self-report measure frequently employed in community-dwelling older populations.
These variables were selected as potential confounders because they may be independently associated with occupational participation and could influence patterns of smartphone use, thereby potentially confounding the observed association between application diversity and occupational participation.
Statistical Analysis
Descriptive statistics were calculated for all the variables. Differences in SOPI scores between the LAD and HAD groups were examined using Welch’s t-test and Pearson’s Chi-square test.
Based on the results of the preliminary two-group comparisons, generalized linear models (GLMs) were constructed to examine whether application diversity was independently associated with occupational participation. SOPI subdomain scores that demonstrated statistically significant differences between application diversity groups were entered as dependent variables, with the application diversity group as the independent variable, adjusted for age, sex, education, living situation, medication, employment status, smartphone usage years, daily smartphone use time, gait speed, GDS-15, KCL, and MMSE scores.
Given the limited sample size, bootstrap resampling (2,000 iterations) was additionally conducted to assess the robustness of the regression coefficients. Statistical significance was set at p < 0.05. All analyses were performed using R software. Given the exploratory nature of these analyses, p-values were not adjusted for multiple comparisons.[24] All statistical analyses were conducted using R version 4.2.2 (R Foundation for Statistical Computing, Vienna, Austria), with the significance level set at p < 0.05.
Results
Characteristics of Study Participants
The participant characteristics by application diversity group are shown in Table 1. Ninety-seven community-dwelling older adults were included in the analysis (median age, 77.0 years; interquartile range [IQR], 75.0–82.0), of whom 73% were female. Regarding employment status, 12 participants (12%) were engaged in remunerative work, 13 (13%) in volunteer work, and 72 (74%) were unemployed. Employment status differed significantly between the application diversity groups (p = 0.048), with remunerative and volunteer work being more common in the HAD group. The median usage of smartphone was 7.0 years (IQR, 4.0–10.0), and 66% of participants reported using smartphones for < 1 h per day. Based on smartphone application diversity, participants were classified into LAD group, defined as those using fewer than five applications (n = 30), and HAD group, defined as those using five or more applications (n = 67).
Compared with the LAD group, participants in the HAD group were significantly younger (p < 0.001) and more likely to report daily smartphone use of ≥ 1 h (p = 0.016). In contrast, the LAD group demonstrated higher GDS-15 scores and higher Kihon checklist KCL scores than that of the HAD group (p = 0.043 and p = 0.016, respectively). No significant between-group differences were observed in terms of sex, educational attainment, living arrangements, medication use, medical history, MMSE, or gait speed.
Smartphone Application Use Patterns
Figure 2 presents the distribution and combinations of smartphone applications used daily by the participants. Figure 2a shows that basic communication-related applications, including phone calls (94%), email (88%), text messaging (78%), and camera (77%), were the most commonly used across the entire sample. Compared with the LAD group, participants in the HAD group showed higher usage rates across a broader range of application categories, including web browsing, camera, QR codes, and healthcare-related applications. In contrast, application use in the LAD group was largely concentrated on communication-focused functions, with lower engagement observed in non-communication applications. Figure 2b illustrates the 10 common combinations of smartphone applications used in the LAD group. In this group, the most frequent combinations were largely limited to basic communication-related applications, particularly phone calls, email, and text messaging, which were either used alone or in simple combinations with one additional application. Figure 2c presents the corresponding application combinations for the HAD group. In contrast to the LAD group, the HAD group exhibited a wider variety of application combinations in which basic communication applications were commonly used alongside multiple additional applications such as web browsing, camera, QR code use, healthcare-related applications, and video streaming.
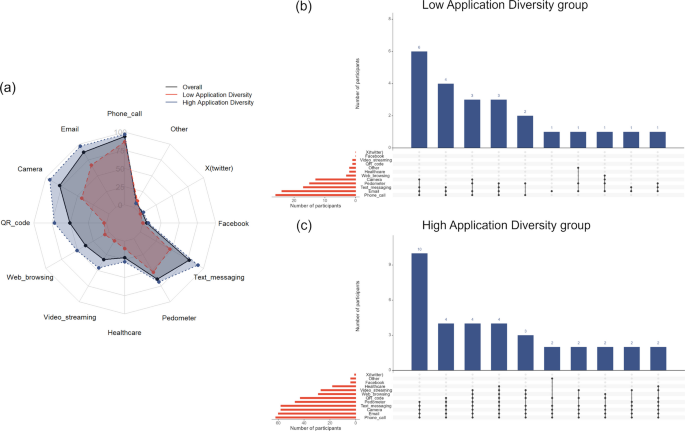
Distribution and Combinations of Smartphone Application Use Among Participants (a) The radar chart presents the percentage of participants reporting daily use of each smartphone application in the overall sample, lower application diversity group (< 5 applications), and higher application diversity group (≥ 5 applications). (b) The plot presents the 10 most frequent application-use combinations in the lower application diversity group. (c) The plot presents the corresponding 10 most frequent combinations in the higher application diversity group. In panels (b) and (c), the vertical bars represent the number of participants with each application-use pattern, the connected dots below each bar indicate the applications comprising that pattern, and the horizontal bars represent the total number of participants using each application
Association Between Application Diversity and Occupational Participation
Figure 3 compares the SOPI scores between the two application diversity groups. The HAD group demonstrated significantly higher overall SOPI scores than that of the LAD group (median [IQR]: 75.0 [58.3–83.3] vs. 55.6 [25.0–75.0], p = 0.002). When the SOPI scores were examined by occupational domain, significant between-group differences were observed in both the leisure and productivity domains. The HAD group had higher leisure scores than that of the LAD group (12.0 [10.0–13.0] vs. 11.0 [5.0–12.0], p = 0.013), and a more pronounced difference was observed for productivity scores (12.0 [9.0–12.0] vs. 6.0 [3.0–12.0], p < 0.001). In contrast, no statistically significant difference was found between the groups in the self-care domain (p = 0.057).
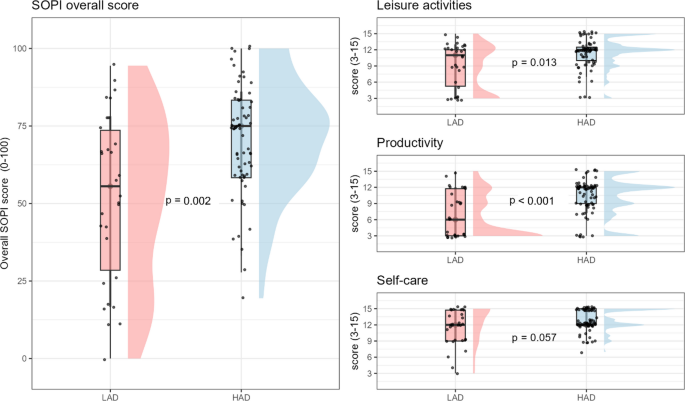
Overall and domain-specific SOPI scores according to smartphone application diversity
Participants were classified into the lower application diversity group (LAD; < 5 applications used daily) and higher application diversity group (HAD; ≥ 5 applications used daily). The overall SOPI score ranges from 0 to 100, whereas the leisure activities, productivity, and self-care domain scores each range from 3 to 15. Higher scores indicate more favorable occupational participation. Individual observations, boxplots, and score distributions are shown. Between-group differences were examined using Welch’s t-test. Abbreviation: SOPI; self-completed occupational performance index.
To examine whether application diversity was independently associated with occupational participation, GLMs were constructed with the SOPI leisure and productivity subscale scores as dependent variables. The application diversity group was entered as the primary independent variable, adjusted for age, sex, education, living alone, medication use, employment status, years of smartphone use, daily smartphone use time, gait speed, and MMSE, KCL, and GDS-15 scores. In the adjusted models, application diversity was not significantly associated with SOPI leisure scores (regression coefficient = 0.66, 95% CI: − 0.89 to 2.22). Full results of the leisure model are provided in Supplementary Table S1. By contrast, using five or more smartphone applications was independently associated with higher SOPI productivity scores (regression coefficient = 2.17, 95% confidence interval [CI]: 0.49–3.86). The GLM results for the SOPI productivity subdomain are presented in Table 2.
The dependent variable was the productivity subdomain score of the Self-Completed Occupational Performance Index.
Robustness Analyses
Given the modest sample size, bootstrap resampling (2,000 iterations) was conducted to assess the robustness of the association between application diversity and productivity. The bootstrap analysis yielded a median regression coefficient of 2.24, with a 95% CI of 0.49–3.86, confirming the stability of the observed association. Table 2 presents the description and distribution of the regression coefficients obtained via bootstrapping.
Discussion
This study examined the association between smartphone application diversity and occupational participation among community-dwelling older adults. The findings indicated that older adults who used a greater variety of smartphone applications demonstrated significantly higher overall occupational participation, with the association driven primarily by the productivity domain. This relationship remained robust after adjusting for age, functional abilities, sociodemographic factors, and smartphone usage/duration, and was further supported by bootstrap analyses. Taken together, the present results indicate that variation in how older adults utilize smartphone applications is associated with more active participation in productive activities and offer additional insight into approaches for supporting occupational participation among older adults.
The participants’ median age exceeded the late seventies, reflecting the demographic reality of aging communities in Japan. Despite the advanced age of the study population, smartphone ownership appeared to be widespread among the older age groups, reflecting the increasing penetration of mobile technologies in later life. However, the observed variability in application diversity highlights the persistent digital heterogeneity of smartphone use. Participants with lower application diversity tended to be older and used smartphones for shorter durations, consistent with prior reports indicating that aging is associated with narrower digital engagement and reduced functional use of information and communication technologies [25, 26]. These characteristics are important when interpreting the findings, as they suggest that application diversity may reflect not only individual preferences but also age-related changes in the cognitive, physical, and experiential factors that shape digital engagement. Longitudinal and population-based studies have linked cognitive function to the use of information and communication technology in later life, indicating that cognitive capacity is an important condition for initiating and sustaining digital engagement [27]. Other studies using objective indicators of impairment have shown that physical and cognitive limitations are associated with the non-use of digital services and lower digital competence, highlighting the role of functional constraints in shaping everyday technology use [28]. Beyond functional capacity, prior syntheses emphasize experiential and contextual factors, such as prior exposure to digital tools, skills, confidence, and the availability of support [29]. Collectively, these findings suggest that heterogeneity in smartphone application diversity may reflect not only individual preferences but also age-related functional changes and accumulated experiences that influence how digital tools are incorporated into daily life.
A key finding was that application diversity was associated with occupational participation in the productivity domain but not with leisure or self-care. This pattern may be partly explained by the increased use of applications such as email, camera, QR codes, web browsing, video streaming, healthcare, and text messaging in the HAD group. These applications may support productivity-related occupations by facilitating information exchange, task or event documentation, access to online services and resources, management of appointments or health-related information, and coordination of daily responsibilities with others. Productivity-related occupations typically involve planning, coordination, information management, and role fulfillment [30, 31], which can be directly supported by multifunctional smartphone use. Applications for communication, scheduling, navigation, and information retrieval may facilitate engagement in socially productive roles such as managing household responsibilities, volunteering, or supporting others. Empirical research supports this interpretation by showing that many older adults use digital methods for instrumental and productivity-related daily tasks, including managing finances, navigating the community, and organizing appointments or to-do activities [32]. Qualitative evidence further indicates that older adults can learn and adopt smartphone-based calendars and reminder systems to support the scheduling and completion of everyday activities, highlighting the practical relevance of mobile tools for planning and coordination [33]. In addition, a systematic review summarized that older adults use off-the-shelf smartphones and tablets, including native applications such as calendar functions and commercially available apps, to support cognition, memory, and activities of daily living, which are closely linked to effective role fulfillment and information management [5]. Notably, only 12% of participants were engaged in remunerative work, whereas 13% participated in volunteer work and 74% were unemployed. Although employment/volunteer status differed between the application diversity groups, the association between higher application diversity and productivity remained significant after adjustment for this variable. This suggests that the observed association is unlikely to reflect formal employment or volunteer participation alone, but may encompass a broader range of productive occupations, including household responsibilities and other roles involving planning, coordination, and responsibility.
In contrast, leisure and self-care activities may depend less on digital tools or may be maintained through established routines. This pattern is consistent with the CMOP-E, which conceptualizes technology as an environmental factor that enables occupational performance and participation. Accordingly, the extent to which technology is related to participation is expected to vary by occupational domain and by an individual’s perceived fit between available environmental support and the demands of specific occupations. Therefore, several alternative explanations must be considered. Reverse causation is possible, because individuals with greater productive role demands may adopt more applications to manage their daily tasks. Residual confounding related to socioeconomic resources, access, and informal support may also remain [29]. In addition, null findings for self-care may reflect a limited measurement fit, as these activities are less readily digitized than instrumental or organizational tasks [34]. Nonetheless, these findings suggest that application diversity may serve as a feasible marker of how everyday technologies are integrated into productivity-oriented occupations that support participation in later life [10].
The findings of this study have several implications for occupational therapy practices in community settings. First, assessing application diversity together with occupational participation may provide occupational therapists with a practical way to better understand the environmental factors that support or constrain older adults’ engagement in meaningful occupations in an increasingly digitalized society. Rather than focusing solely on ownership or overall screen time, clinicians may benefit from examining which applications are used in daily life, and how these patterns align with specific occupational demands and goals. Second, interventions that support purposeful and selective smartphone use, particularly for productivity-related activities, may facilitate participation in meaningful occupations among older adults; however, this possibility requires further empirical evaluation. In addition, higher smartphone proficiency was associated with higher-level competence [35], suggesting that supporting skill development may be relevant when designing occupation-centered digital interventions. Occupational therapists are well-positioned to develop individualized interventions that align smartphone use with clients’ values, routines, and roles. This approach may become increasingly important as digital technologies continue to mediate access to services, information, and social participation in aging societies.
Llimitations
Some limitations of this study should be considered when interpreting the results. First, the sample size was relatively small, which may limit the statistical power and generalizability. Although bootstrap analyses were conducted to address this limitation, replication in a larger sample is warranted. In addition, 73% of the participants were female, which may limit the generalizability of the findings to older men. Future studies with more balanced sex distributions are needed to determine whether similar associations are observed across sexes. Second, its cross-sectional design precludes causal inferences. It remains unclear whether greater application diversity leads to higher occupational participation or whether individuals with higher occupational participation are more likely to adopt diverse smartphone applications. Longitudinal studies are required to clarify the directionality of this relationship. Third, smartphone-related variables, including application use and duration of smartphone use, were assessed using self-reported measures, which may have been subject to recall or misclassification bias. In particular, because a specific technical definition of a smartphone was not provided, some participants may have interpreted the duration-of-use question broadly and included previous use of feature phones. Although no clearly implausible values were observed in the reported duration of smartphone use, this possibility cannot be completely excluded. Objective measures of smartphone use, such as usage logs, can complement self-reported data in future research. Despite these limitations, this study provides novel insights into the relationship between digital engagement and occupational participation in later life.
Conclusion
This study demonstrated that greater smartphone application diversity is associated with higher occupational participation among community-dwelling older adults, particularly in the productivity domain. These findings suggest that application diversity may serve as a meaningful indicator of the integration of digital technologies into everyday occupations. From an occupational therapy perspective, supporting older adults in expanding and purposefully using smartphone applications may improve their participation in productive roles and activities. Future research should employ longitudinal designs and larger samples to further elucidate the mechanisms linking digital engagement and occupational participation and to inform the development of occupation-centered digital interventions for aging populations.
Data Availability
The data that support the findings of this study are available on request from the corresponding author, S.S. The data are not publicly available due to restrictions their containing information that could compromise the privacy of research participants.
Change history
27 September 2026
This article was updated to correct the asisgned affilations for the following authors: Kazuki Yokoyama, Hidekazu Saito, and Nozomu Ikeda from 3 to 2; Masayuki Kobayashi, Kiyotaka Shimada, Kosuke Yama from 3 to 8; and Ryo Miyajima from 8 to 9. Affiliation 3 was corrected from Department of Occupational Therapy to Department of Physical Therapy. Affiliation 8 was corrected from Ebetsu city hospital, Ebetsu, Japan to Graduate School of Health Sciences, Sapporo Medical University, Sapporo, Japan. Ebetsu city hospital, Ebetsu, Japan becomes affiliation 9.
References
Gianfredi V, Nucci D, Pennisi F, et al. Aging, longevity, and healthy aging: the public health approach. Aging Clin Exp Res. 2025;37:125.
Minisry of Internal Affairs and Communications. White Paper. MIC ICT Policy, https://www.soumu.go.jp/main_sosiki/joho_tsusin/eng/whitepaper/index.html (2023, accessed 6 October 2023).
Sagong H, Yoon JY. The effects of smartphone use on life satisfaction in older adults: the mediating role of depressive symptoms. Comput Inform Nurs. 2022;40:523–30.
Beneito-Montagut R, Rosales A, Fernández-Ardèvol M. Emerging digital inequalities: a comparative study of older adults’ smartphone use. Soc Media + Soc. 2022;8:20563051221138756.
Wilson SA, Byrne P, Rodgers SE, et al. A systematic review of smartphone and tablet use by older adults with and without cognitive impairment. Innov Aging. 2022;6:igac002.
Lin L, Jing X-C, Lv S-J, et al. Mobile device use and the cognitive function and depressive symptoms of older adults living in residential care homes. BMC Geriatr. 2020;20:41.
Shimokihara S, Tabira T, Maruta M, et al. Smartphone proficiency in community-dwelling older adults is associated with higher-level competence and physical function: a population-based age-specific cross-sectional study. J Appl Gerontol. 2025;44:52–61.
Ok C. The dual impact of smartphone app usage diversity on quality of life: the moderating roles of age and digital literacy. Eur J Investig Health Psychol Educ. 2025;15:221.
Gordon ML, Gatys L, Guestrin C, et al. App Usage Predicts Cognitive Ability in Older Adults. In: Proceedings of the 2019 CHI Conference on Human Factors in Computing Systems. New York, NY, USA: Association for Computing Machinery, pp. 1–12.
Mendoza-Holgado C, García-González I, López-Espuela F. Digitalization of activities of daily living and its influence on social participation for community-dwelling older adults: a scoping review. Healthcare (Basel). 2024;12:504.
Townsend EA, Polatajko HJ. Enabling occupation II: advancing an occupational therapy vision for health, well-being, and justice through occupation. Canadian Association of Occupational Therapists; 2013.
Shimokihara S, Yokoyama K, Ihira H, et al. Association between occupational participation and quality of life in Japanese older adults. OTJR. 2025. https://doi.org/10.1177/15394492251327983.
Khourieh H, Fogel-Grinvald H, Golos A. Participation and quality of life among older adults: comparison study of ethnic majority and minority groups. Am J Occup Ther. 2025. https://doi.org/10.5014/ajot.2025.050902.
Polatajko H, Davis J, Stewart D, et al. Specifying the domain of concern: Occupation as core. Teoksessa EA Townsend ym.(toim.) Enabling occupation II: Advancing an occupational therapy vision for health, wellbeing, and justice through occupation.
Kineree Shah. How many apps do Americans download? yougov, https://yougov.com/en-us/articles/51942-how-many-apps-do-americans-download?utm_source=chatgpt.com (2025, accessed 24 December 2025).
Imai T, Saito S. Measuring the quality of participation in activities in everyday life: developing the Self-completed Occupational Performance Index (SOPI). Jpn Occup Ther Res. 2010;29:317–25.
Shuai Z, Jingya Z, Qing W, et al. Associations between sedentary duration and cognitive function in older adults: a longitudinal study with 2-year follow-up. J Nutr Health Aging. 2023;27:656–62.
Calhoun D, Lee SB. Computer usage and cognitive capability of older adults: analysis of data from the Health and Retirement Study. Educ Gerontol. 2019;45:22–33.
Peters DM, Fritz SL, Krotish DE. Assessing the reliability and validity of a shorter walk test compared with the 10-meter walk test for measurements of gait speed in healthy, older adults. J Geriatr Phys Ther. 2013;36:24–30.
Middleton A, Fritz SL, Lusardi M. Walking speed: the functional vital sign. J Aging Phys Act. 2015;23:314–22.
Folstein MF, Folstein SE, McHugh PR. ‘Mini-mental state’. A practical method for grading the cognitive state of patients for the clinician. J Psychiatr Res 1975; 12: 189–198.
Satake S, Senda K, Hong Y-J, et al. Validity of the Kihon Checklist for assessing frailty status. Geriatr Gerontol Int. 2016;16:709–15.
Sugishita K, Sugishita M, Hemmi I, et al. A validity and reliability study of the Japanese version of the Geriatric Depression Scale 15 (GDS-15-J). Clin Gerontol. 2017;40:233–40.
Rubin M. Do p values lose their meaning in exploratory analyses? It depends how you define the familywise error rate. Rev Gen Psychol. 2017;21:269–75.
Jessen F, Amariglio RE, van Boxtel M, et al. A conceptual framework for research on subjective cognitive decline in preclinical Alzheimer’s disease. Alzheimers Dement. 2014;10:844–52.
Yang R, Gao S, Jiang Y. Digital divide as a determinant of health in the U.S. older adults: prevalence, trends, and risk factors. BMC Geriatr. 2024;24:1027.
Choi EY, Wisniewski KM, Zelinski EM. Information and communication technology use in older adults: a unidirectional or bi-directional association with cognitive function? Comput Human Behav. 2021;121:106813.
Heponiemi T, Kainiemi E, Virtanen L, et al. Predicting internet use and digital competence among older adults using performance tests of visual, physical, and cognitive functioning: longitudinal population-based study. J Med Internet Res. 2023;25:e42287.
Kebede AS, Ozolins L-L, Holst H, et al. Digital engagement of older adults: scoping review. J Med Internet Res. 2022;24:e40192.
Jefferson AL, Paul RH, Ozonoff A, et al. Evaluating elements of executive functioning as predictors of instrumental activities of daily living (IADLs). Arch Clin Neuropsychol. 2006;21:311–20.
Ikeda Y, Ogawa N, Yoshiura K, et al. Instrumental activities of daily living: the processes involved in and performance of these activities by Japanese community-dwelling older adults with subjective memory complaints. Int J Environ Res Public Health. 2019;16:2617.
Benge JF, Aguirre A, Scullin MK, et al. Digital methods for performing daily tasks among older adults: an initial report of frequency of use and perceived utility. Exp Aging Res. 2024;50:133–54.
Baric V, Andreassen M, Öhman A, et al. Using an interactive digital calendar with mobile phone reminders by senior people - a focus group study. BMC Geriatr. 2019;19:116.
Mois G, Rogers WA. Developing a framework for digital activities of daily living. Gerontologist. 2024;64:gnae110.
Shimokihara S, Tanaka H, Boot WR, et al. Development of the Japanese version of the Mobile Device Proficiency Questionnaire: a cross-sectional validation study. Geriatr Gerontol Int. 2024;24:1223–32.
Acknowledgements
We would like to thank all the study participants and the research staff for their contributions to the study. We would like to thank Editage (www.editage.jp) for the English language editing.
Author information
Authors and Affiliations
Contributions
Conceptualization, S.S., K.Y.; Data curation, S.S., K.Y.; Funding acquisition, S.S.; Investigation, K.Y., H.I., YM.K., A.M., H.T., H.S., K.M., S.K., M.K., K.S., K.Y., R.M., T.S.; Methodology, S.S.; Project administration, K.Y., H.I., N.I.; Supervision, H.I., N.I.; Writing–original draft, S.S., K.Y.; Writing–review & editing, H.I., YM.K., A.M., H.T., H.S., K.S., K.Y., R.M., T.S., N.I. All authors have read and approved the final version of the manuscript.
Corresponding author
Additional information
Publisher's Note
Springer Nature remains neutral with regard to jurisdictional claims in published maps and institutional affiliations.
Supplementary Information
Below is the link to the electronic supplementary material.
ESM 1 (download DOCX )
(DOCX 25.9 KB)
Rights and permissions
Open Access This article is licensed under a Creative Commons Attribution 4.0 International License, which permits use, sharing, adaptation, distribution and reproduction in any medium or format, as long as you give appropriate credit to the original author(s) and the source, provide a link to the Creative Commons licence, and indicate if changes were made. The images or other third party material in this article are included in the article's Creative Commons licence, unless indicated otherwise in a credit line to the material. If material is not included in the article's Creative Commons licence and your intended use is not permitted by statutory regulation or exceeds the permitted use, you will need to obtain permission directly from the copyright holder. To view a copy of this licence, visit http://creativecommons.org/licenses/by/4.0/.
About this article

Cite this article
Shimokihara, S., Yokoyama, K., Ihira, H. et al. Association Between Smartphone Application Diversity and Occupational Participation Among Community-Dwelling Older Adults: A Cross-Sectional Study. Scand. J. Occup. Ther. 33, 5 (2026). https://doi.org/10.1007/s44474-026-00007-1
Received:
Accepted:
Published:
Version of record:
DOI: https://doi.org/10.1007/s44474-026-00007-1