


Abstract
We have developed a straightforward and eco-friendly one-step hydrothermal synthesis method (100 °C for 5 min) to produce Carbon Dots (CDs) derived from a common beetle species Luprops tristis (L. tristis), a novel source among various green sources of CDs. These CDs exhibit robust fluorescence, making them suitable for bioimaging, biosensors, and antibacterial treatments. They demonstrate high stability without the need for surface passivation additives, and their versatile surface groups enable compatibility with bioanalytical techniques and solubility in hydrophilic solvents. The UV-Vis spectrum shows an absorption peak at 225 nm, corresponding to π-π* transitions of the C = C bond. FTIR spectra highlight functional groups involved in the formation and reduction of these CDs, while Raman spectroscopy confirms the D and G band of CDs. TEM analysis also revealed that the prepared CDs were uniformly distributed with an average particle size of 3.9 nm. XRD analysis revealed a broad diffraction peak around 23°, confirming the amorphous graphitic nature of the biosynthesized CDs derived from L. tristis. These characteristics position CDs as promising biomedical tools for monitoring human health. Furthermore, the synthesized CDs have demonstrated effective antibacterial properties against both Gram-positive and Gram-negative bacteria, antioxidant properties, and anticancer properties towards DLA cells. Overall, the attributes of these environmentally friendly CDs suggest they can be readily scaled up for large-scale production without harmful chemicals, highlighting their potential in sustainable biomedical applications. Although CDs have been synthesized from various green sources documented in the literature, deriving CDs from insect secretions has not been recorded. This study presents a novel and innovative approach by synthesizing CDs from L. tristis secretions, revealing significant potential for biomedical applications.
Graphical Abstract

1 Introduction
Biological resources have been extensively explored for the green synthesis of various nanomaterials, including metallic nanoparticles, metal oxide nanoparticles, and fluorescent carbon-based nanomaterials [1,2,3,4,5]. Carbon-based nanomaterials such as carbon nanofibers, nanotubes, nanodiamonds, graphene, fullerenes, and Carbon Dots (CDs) are known for their fluorescence and applications in different fields [6, 7], including bio-imaging, drug delivery systems, biosensing, and catalysis [8, 9]. CDs are nanomaterials ranging from 2 to 8 nm in diameter and are gaining popularity as an alternative to metal-based quantum dots for their fluorescence, biocompatibility, and low toxicity [10]. Two major strategies for synthesizing CDs are top-down approaches such as electrochemical oxidation and bottom-up approaches such as hydrothermal, microwave-assisted, and ultrasonic methods. CDs are known for their fascinating characteristics and potential on both theoretical and practical grounds [11,12,13,14]. CDs can be synthesized from a variety of organic or bioinorganic sources by means of electrochemical synthesis, combustion method, hydrothermal method, laser ablation method, etc. Different plant species have been employed for the eco-friendly synthesis of CDs by means of the hydrothermal method. These plants are Eleocharis dulcis [15], Azadirachta indica [16], maize [17], rose heart radish [18], Ocimum sanctum [19], scallion [17], strawberry [20], tulsi [21], Tamarindus indica [22], and Abelmoschus manihot [23], etc. In addition, walnut was also solvothermally synthesized [24], while watermelon [25], bamboo, and lotus [26] were also synthesized by the microwave method. In addition, the diameter of the nanoparticles varies from 2 to 9 nm. In addition, different fungal species such as mushroom were also employed for the one-step hydrothermal synthesis of CDs and their application for the sensing of hyaluronidase [27].
CDs have shown remarkable optical properties, especially photoluminescence (PL), which is important in biological investigations. CDs have shown low cytotoxicity and have potential for live cell imaging, especially for near-infrared imaging [28]. The promising use of CDs as biomarkers for differentiating between normal and cancer cells has been established by the fluorescence quenching properties of folic acid modified CDs that attach to the folate receptors of cancer cells [29, 30]. CDs have shown potential for use in biosensors for detecting different substances such as ions, pH levels, proteins, enzymes, vitamins, and nucleic acids [31, 32]. CDs have shown potential for detecting ions and physiological pH levels in living cells and tissues. CDs have shown potential for developing biosensors for detecting nucleic acids, proteins, and enzymes such as histone using double-stranded DNA [33].
CDs are non-toxic, photostable fluorescent nanoprobes widely used for bioimaging. They also enable imaging-guided photothermal therapy with enhanced tumor uptake and controlled drug release [34]. Wang et al. have incorporated various functionalities, demonstrating significant therapeutic efficacy [35]. Drug delivery using CDs is facilitated by their ability to carry drugs. CDs that respond to pH release chemotherapeutic agents like doxorubicin to cancerous cells, whereas CQDs are used in gastrointestinal drug delivery [36]. The use of biomaterials for synthesizing CDs has been found to be an eco-friendly and cost-effective method, making them even more attractive [37]. This method not only reduces harm to the environment but also incorporates renewable resources [38,39,40]. Although CDs have been synthesized from a wide range of plant- and biomass-derived precursors, no previous study has reported the use of L. tristis defensive secretion as a carbon source. This study explores the novel synthesis of CDs from L. tristis, representing the first reported insect-derived CDs for biomedical applications, building on the proven effectiveness of insect secretions in green nanoparticle synthesis [41,42,43,44,45]. Encouraged by these findings, we explored the defensive gland secretion of L. tristis as a unique carbon-rich precursor for the synthesis of carbon dots with potential biomedical applications. CDs have been synthesized from insects’ defensive secretions, providing innovative tools for drug delivery and diagnostics, thus bridging the gap between biology, chemistry, and materials science.
2 Materials and methods
2.1 Preparation of defensive gland secretion of L. tristis
The L. tristis beetles were collected from the college campus in Pattambi, Kerala, India. This place is surrounded by detritus-rich forests. These beetles usually live in the crevices of buildings and trees. The beetles were collected by hand and placed in perforated bottles. This is a type of darkling beetle belonging to the family Tenebrionidae. This type of beetle is commonly found in India and survives on detritus. Though the beetles are harmless to the skin and are 8 mm in size, they secrete a phenolic fluid when disturbed. This fluid is composed of bioactive compounds such as phenols, flavonoids, and alkaloids. These compounds play a crucial role in the reduction and capping of materials [46]. Though the beetles are harmless to the skin, they can be pests when they invade buildings in large numbers (Fig. 1). The beetles were kept in aerated vessels and transferred to the lab. The defense glands of the beetles were obtained by gently pressing the abdomen of the beetles without harming them (Fig. 2). The secretions were collected in Eppendorf tubes containing distilled water to prevent contamination. This solution is then used to prepare the CDs.

Defensive gland system of L. tristis. (a) Image of the paired defensive glands isolated from the beetle abdomen under a light microscope. (b) Image of a single gland lobe containing yellow secretory vesicles. (c) SEM image of the whole gland pair

Aggregating behavior of L. tristis in homes. (a) An adult beetle (size ~8 mm). (b) Collection of beetles in a petri dish. (c–i) Representative images of beetles aggregating on building surfaces such as doorframes, window frames, wall crevices, electric switchboards, and lighting fixtures
2.2 Synthesis of CDs from L. tristis
The CDs were synthesized by a hydrothermal method. It is accepted that the hydrothermal method is the predominant method for the synthesis of green CDs. It is a cost-effective and simple process. In the process of synthesizing CDs by the green method, it has been emphasized that water or environmentally friendly organic solvents such as ethanol must be used. In addition, the solvents are also considered a renewable source of carbon. In contrast, the use of a solvent-free method has also been emphasized by carrying out the process at a high temperature of up to 300 °C at normal pressure [47]. In the experiment, 5 ml of DGS of L. tristis was only used for the preparation of CDs by a hydrothermal method at 100 °C for 5 min. After synthesis, the obtained CDs solution was first centrifuged at 4000 rpm for 10 min to remove large particulates and insoluble residues. The supernatant was subsequently purified by dialysis using a dialysis membrane (MWCO 3.5 kDa) against deionized water for 24 h at 37 °C. The dialysis medium was replaced periodically to ensure efficient removal of unreacted precursors and low-molecular-weight impurities. The purified CDs solution was then collected and stored at 4 °C for further characterization and biological studies.
2.3 Characterization
The synthesised CDs from the DGS of L. tristis were characterized by various methods of analysis. The reduction analysis was carried out by using UV-Visible spectroscopy, and the results were obtained by using PerkinElmer UV WinLab equipment. FTIR spectroscopy was used to identify the compounds that bind with the synthesized CDs during stabilization, and the analysis was carried out by using PerkinElmer IR equipment. Confocal Raman spectroscopy was used to confirm the synthesized CDs. Fluorescence emission was confirmed by using a UV cabinet, and further confirmation was obtained by using photoluminescence spectroscopy, where the analysis was carried out by using ORIGIN JASCO equipment. The shape and size of the synthesized nanoparticles were analyzed by using TEM, where the analysis was carried out by using JEOL JEM-2100 equipment. The crystalline phase of the synthesized CDs was identified using an advanced powder X-ray diffractometer (XRD, D8, Bruker, Germany). Stability, an important parameter of nanoparticles, was analyzed by using zeta potential analysis, where the analysis was carried out by using HORIBA SZ-100 equipment, and dynamic light scattering was used to determine the hydrodynamic diameter of the synthesized nanoparticles. The DLS and zeta potential measurements were carried out using aqueous dispersions of CDs prepared in deionized water at approximately neutral pH (pH ~ 7).
2.4 Biological applications
2.4.1 Antibacterial analysis
The bactericidal effect of CDs was checked by a dose-dependent disc diffusion assay for Gram-negative and positive bacteria (Klebsiella pneumoniae - ATCC 700603 and Staphylococcus aureus - ATCC 33591). Agar plates were prepared and microbial cultures were swabbed onto these agar plates. CD solutions at two different concentrations (5 µg, 10 µg) were used for the experiment. Disks of filter paper soaked in CD solutions were kept on Petri dishes, and positive and negative control (tetracycline and water) were also used. After incubation at 35 °C for 16 hours, the inhibitory zone was recorded. The antibacterial assay was performed using three independent replicates (n = 3), and inhibition zones are presented as mean ± SD.
2.4.2 Antioxidant activity- DPPH assay
In the DPPH assay for antioxidant activity, CDs from L. tristis secretion were used to test their antioxidant properties. To conduct the DPPH assay, a solution of 0.1 mM DPPH was prepared by adding 3.94 mg of DPPH to 100 mL of methanol. CDs solutions of 20 µg/mL, 40 µg/mL, and 60 µg/mL were prepared by dissolving the CDs in methanol and then ascorbic acid was used as a positive control. The reaction mixture for the DPPH assay was prepared by reacting 2 mL of the 0.1 mM DPPH solution with 2 mL of each of the CDs solutions and ascorbic acid solution. The reaction mixture was then incubated at room temperature for 30 minutes in the dark. After incubation, the absorbance of each reaction mixture was recorded at 517 nm by a UV-Vis spectrophotometer. The percentage of DPPH scavenging activity (S%) was calculated by the following standard formula:
where A control is the absorbance of the control and A sample is the absorbance of the sample containing CDs. The DPPH assay was performed in triplicate (n = 3), and the results are expressed as mean ± standard deviation (SD).
2.4.3 Anticancer assay
The in vitro cytotoxicity of CDs was assessed by testing against Dalton’s Lymphoma Ascites (DLA) cell lines. The test compounds were dissolved in distilled water. The concentration of the test compounds was varied from 15 µg/mL to 20 µg/mL. Cells from a tumor ascites suspension are aspirated from the peritoneal cavity of a mouse with a DLA ascites tumor. Cells are washed three times with PBS and suspended in a viable cell suspension of 1 × 10⁶ cells in 0.1 mL. To this cell suspension, test compound solutions of different concentrations are added. Finally, the volume of the cell suspension is made up to 1 mL with PBS. The control contains cell suspension only. After this mixture has been incubated at 37 °C for 3 hours, 0.1 mL of 1% trypan blue is added to the mixture. Cells are loaded on a hemocytometer, and the number of live and dead cells is counted. In this case, live cells exclude the dye, while dead cells take up the dye. Percent cytotoxicity is determined by the formula as per standard procedure [48]. The percentage of cytotoxicity was calculated using the following equation:
where the total number of cells = viable cells + non-viable cells. Each treatment was tested in triplicate (n = 3), and the experiment was repeated independently three times.
2.4.4 Statistical analysis and data evaluation
Each bioassay was repeated three times to ensure reliability and relevance. In the antimicrobial studies, a statistical approach was also employed. In addition, the results are presented in a table format showing the results as mean ± standard deviation (SD), where the average and SD are calculated for each group of treatments.
3 Results and discussions
Bottom-up method of hydrothermal was utilized for the formation of CDs. After that, purification of CDs was done by means of a dialysis method; it was carried out using distilled water for 24 hr at 37 °C with a membrane for the removal of small molecules. The synthesized CDs were then collected and stored at 4 °C for the next analysis.
3.1 UV-Vis spectroscopy
The ultraviolet-visible spectrum of the synthesized CDs was accurately recorded using a spectrophotometer (Perkin Elmer Hitachi, Japan). For the purpose of this analysis, 4 mL of the CDs sample solution was accurately measured and placed in a cuvette. The spectrum was recorded over a range of 200–600 nm, thus accurately describing the optical properties of the synthesized CDs. As depicted in Fig. 3, the spectrum showed distinct peaks at a wavelength of 225 nm, which is a clear indicator of the colloidal nature of the synthesized CDs. The peak at 225 nm corresponds to π-π* transitions, which involve the electron transition in the functional groups of the CDs [49]. The peak at 225 nm corresponds to π-π* transitions involving C = C bonds [50].

UV-visible absorption spectrum of CDs prepared from the defense secretion of L. tristis, measured in aqueous medium over the wavelength range of 200–600 nm. An absorption peak is observed at 225 nm
As per previous studies, leaves of Polyalthia longifolia also show UV absorption peaks at 225 nm [50]. Moreover, N-CDs synthesized using unripe “Prunus mume” fruit extract [51, 52]. And also conventional synthesis techniques show UV absorption peaks, though the wavelength varies according to the method of synthesis [53].
3.2 FTIR Analysis
The CDs mostly comprise the elements such as oxygen, carbon, and hydrogen. Due to the partial oxidation of the carbon source, various functional groups would be present in the CDs. This can be analyzed by Fourier Transform Infrared (FTIR) spectroscopy. The FTIR spectra of the CDs as represented in Fig. 4. The analysis of the CDs synthesized by the proposed method has shown various peaks. The peaks present in the CDs include 3355 cm−1, which is attributed to the presence of O-H groups. The peak present at 2905 cm−1 is attributed to the presence of C-H bonds. The peak present at 1593 cm−1 is attributed to the presence of the C = O bonds. The peak present at 1394 cm−1 is attributed to the presence of the C = C bonds. The peak present at 1048 cm−1 is attributed to the presence of the C-O bonds. This proves the occurrence of the condensation reaction, intermolecular cyclization, or the decomposition of the CDs.

FTIR spectra of the crude extract of defensive gland secretion (black trace) and synthesized CDs (red trace) recorded between 4000 and 500 cm−1. Characteristic absorption peaks are observed at 3355, 2905, 1593, 1394, and 1048 cm−1
The functional groups found on the synthetic CDs were identified using FTIR spectroscopy analysis. The current synthetic C-dots have a similar structure to those of the starting material, i.e., the gland secretion according to FTIR results. However, some new peaks were observed compared to the starting material. The absorption peak at 3355 cm−1 corresponds to O-H stretching [54]. At 2905 cm−1, the current synthetic C-dots have C-H stretching absorption peaks according to Jia et al. [55]. The absorption peak at 1593 cm−1 corresponds to C-O stretching according to the FTIR results of Oh et al. [56]. The absorption peak at 1394 cm−1 corresponds to COO− according to the FTIR results of Yan et al. [57]. Moreover, the absorption peak at 1048 cm−1 corresponds to C-O according to Pandey and Pitman [58]. The change in peaks indicates that new bonds are forming while old bonds are breaking; therefore, it confirms that the starting material has undergone a chemical change to produce C-dots with different functionalities.
3.3 Confocal raman spectroscopy analysis
Raman spectroscopy was used to identify the major peaks present in the CDs sample. There were two major peaks identified, the D peak, which corresponds to the sp3 carbon, and the G peak, which corresponds to the graphitic carbon arranged in a two-dimensional structure, as shown in Fig. 5. The technique was used to identify the defects present in the CDs. The unresolved bonds present at the surface were identified using the Raman spectroscopy technique [59]. Confocal Raman spectroscopy is an advanced technique that is very sensitive to the surface. The technique can detect and analyze the bonds present at the surface, i.e., the dangling bonds. The dangling bonds contain unpaired electrons present at the surface of the material. The bonds have a major impact on the material properties. In addition, the Raman spectroscopy technique helps in the characterization of the surface states, which have a major impact on the properties of the material, such as adhesion. The technique is used for the real-time analysis of the material, which is very useful for the refinement of the material. The analysis of the material gives the knowledge of the durability and stability of the material [60, 61].
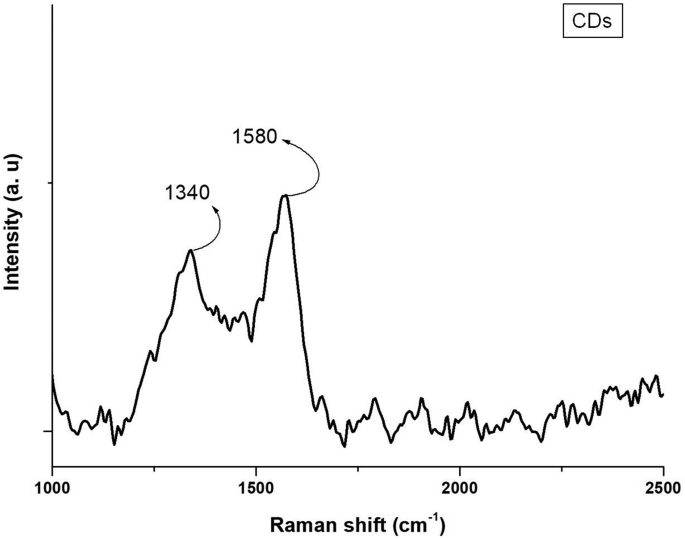
Confocal Raman spectrum of the synthesized CDs, showing two peaks at 1340 cm−1 (D band) and 1580 cm−1 (G band)
structural features of CDs were studied through Raman spectroscopy. Usually, the spectrum of CDs includes two major peaks: the D band, which is associated with sp3 hybridized carbon atoms and is related to structural defects, and the G band, which is associated with sp2 bonded carbon atoms and is related to the formation of a 2D lattice [62]. In this article, the authors used Raman spectroscopy as a powerful and non-destructive method for studying the structural defects of CDs. The spectrum showed peaks at 1340 cm−1 and 1580 cm−1 (Fig. 5). These peaks are related to the D band of the CD spectrum, which is related to unpaired bonding of carbon atoms on the terminal plane of the amorphous structure of the CD material, and the G band of the spectrum, which is related to the vibrations of sp2 hybridized carbon atoms in the 2D lattice of the CD material, respectively [59].
3.4 Fluorescence analysis
CDs display strong green luminescence under UV light that is characteristic and distinct from the fresh DGS (Fig. 6). These bands are indicative of the presence of normal π orbitals and the widespread distribution of C = C and C = O bonds by π-π* and n-π* transitions. The significant extension of the absorption bands into the visible region of the spectrum is indicative of the nanometer scale of the particles that are synthesized. Fluorescence is a characteristic feature of CDs. It is a result of the structure of CDs, which has a core of carbon and different functional groups decorating it. It is a result of the core and the surface or edge groups of CDs. In CDs, oxygen-containing functional groups are the most prevalent. These are responsible for the fluorescence of CDs by virtue of their ability to confine aromatic sp2 domains of sizes less than ten nanometers with sp3 structured linear groups.

Photographs of the CD solution after purification in a quartz cuvette under different lighting conditions: (a) sunlight, showing a transparent yellowish-brown dispersion; (b) far UV light, showing green fluorescence; (c) near UV light, showing blue-green fluorescence
3.5 Photoluminescence emission
The photoluminescence spectrum of the prepared CDs from L. tristis is presented in Fig. 7. The spectrum of the prepared CDs was recorded at an excitation wavelength of 250 nm. It showed two emission bands at 450 nm and 550 nm, respectively, confirming the photo luminescent nature of the prepared CDs. The fluorescence intensity of the prepared CDs is recorded between 300 and 750 nm. Figure 7 indicates the fluorescence strength increased gradually and reached a maximum at 450 nm and then decreased at 550 nm, confirming the presence of multiple emission fluorescence [19].

Photoluminescence (PL) emission spectra of the CDs recorded at an excitation wavelength of 250 nm over the 300–750 nm range. Two emission peaks are observed at 450 nm and 550 nm, with peak emission at 450 nm
Optical properties were also studied through fluorescence emission and UV-Vis absorption spectra, which showed green fluorescence when excited by UV light and absorption peaks at 450 nm and 540 nm when excited at 250 nm (Fig. 7). This is due to the versatility of CD emission properties. Additionally, the maximum emission of CDs occurred at 450 nm. The CDs, having dimensions smaller than 10 nm, have a high surface area relative to their volume and surface atoms; thus, they interact greatly with other molecules and show a high change in fluorescence intensity.The n-π* electronic bandgap transition is responsible for the presence of a notable peak at 225 nm in the UV-Vis spectrum of CDs. The intensity of fluorescence emission depends on the surface properties and the amount of CD particles present [63]. Research on CD properties also showed green fluorescence for CDs synthesized through environmentally friendly methods [64], such as grape fruit [65]. The presence of fluorescence emission peaks at 450 nm and 540 nm is useful for bio-imaging and bio-sensing due to their double emission properties, which make them useful for ratiometric sensing and multiplexing. These peaks improve sensitivity and resolution in bio-imaging and visualization of biological structures at higher detail and resolution. Additionally, their use in biomedical applications is beneficial for the visualization of biological structures and for gaining additional information regarding the subject of interest [66, 67].
3.6 Zeta potential and dynamic light scattering (DLS) analysis
Zeta potential analysis is used to characterize the stability of the prepared CDs by Horiba nanoparticle analyzer (Fig. 8). The zeta potential of CD is −22.6 mV due to the presence of numerous O-H, C = O, and COOH groups. The negative zeta potential indicates the stable effective dispersion of CDs in aqueous solutions. The present work also reveals CDs having 8.06 nm hydrodynamic diameter (Fig. 9).

Zeta-potential profile of the CDs dispersed in deionized water at neutral pH (~7), showing a single peak at −22.6 mV

DLS particle size distribution curve of the CDs in aqueous solution (deionized water, pH ≈7). The intensity-based size distribution is centered at 8.06 nm hydrodynamic diameter; the histogram plot of particle size frequency is shown in the inset
The zeta potential of the CDs in water at −22.6 mV revealed a negatively charged surface due to the presence of hydroxyl (−OH), carbonate (CO), and carboxyl (−COOH) groups. The negatively charged surface ensures moderate colloidal stability rather than highly stable dispersion. Similar observations have been reported by other authors; for instance, Sahu et al., [68] and Dinç [69] reported the presence of hydroxyl and carboxylate groups on the surface of CDs, which is responsible for the negatively charged zeta potential of CDs. This observation is in good agreement with the present investigation and validates the observations of other authors [70]; Shahshahanipour et al. 2019 [71]. Hence, the negatively charged zeta potential of CDs ensures good stability and dispersion of CDs in water, which is a prerequisite for their application in biological and sensing applications. The low hydrodynamic diameter of 8.06 nm ensures the CDs are at the nano-scale for their optical and catalytic properties.
3.7 Transmission electron microscopy (TEM) analysis
The size and microstructure of the CDs were analyzed using Transmission electron microscopy (TEM), as depicted in Fig. 10, reveals that the prepared CDs were well distributed, with an average size of 3.9 nm, as analyzed using TEM. The CDs were found to have a spherical structure. The analysis of the images reveals that the majority of the CDs were in the range of 3–5 nm.

TEM analysis of the CDs. (a) TEM micrograph at low magnification (scale bar = 500 nm), showing well-dispersed particles. (b) HRTEM micrograph (scale bar = 5 nm), showing quasi-spherical structures with individual sizes of approximately 3–5 nm. (c) SAED pattern showing a diffused ring. (d) Histogram of particle size distribution with a Gaussian fit, yielding an average size of 3.9 nm
HRTEM was also used to investigate the orientation and size of CDs. The TEM images in Fig. 10 clearly show that the CDs are spherical and evenly dispersed. CDs have a spherical shape according to previous research findings on CDs [72,73,74]. Larger hydrodynamic diameter observed in DLS compared to TEM is due to the hydration layer and surface functional groups surrounding the CDs in aqueous medium. In another research work on CDs, the unmodified Henna CDs were treated using a hydrothermal method and showed a small range of 3 nm to 7 nm in size [75]. TEM analysis was also used to determine the dimension of CDs and found that they were uniformly dispersed with a mean particle size of 3.9 nm, which is consistent with previous research findings on CDs [76]. For instance, Jiang et al., showed TEM images of graphene quantum dots (GQDs) with an average lateral size of 3.4 nm [77]. CDs obtained from green synthesis have a range of 2–12 nm in diameter, as shown in TEM analysis of CDs [24]. According to literature findings, it has been shown that most of the CDs obtained from green synthesis have a smaller diameter compared to others [78].
3.8 XRD pattern of CDs
A broad diffraction peak at 23° related to the (002) lattice plane can be seen (Fig. 11), which denotes the formation of either amorphous or turbostratic carbon structure. From the broadness of the diffraction peak, it is clear that the obtained carbon nanoparticles have poor crystallinity, resulting in the formation of nano graphitic domains, which is an inherent property of CDs. The wide diffraction peak found at about 23° in the current investigation is also in conformity with the findings of similar investigations on CDs synthesized using natural precursor sources; these generally have an amorphous graphitic structure. The existence of similar (002) wide diffraction peaks in plant-synthesized and biomass-sourced CDs synthesized through hydrothermal synthesis technique confirms the formation of a disorderly carbon-based nanostructure. Relative to previous studies, the obtained C-dots from L. tristis were shown to have low crystallinity and turbostratic carbon nature Fig. 11.

Powder X-ray diffraction (XRD) pattern of CDs prepared from the defensive secretion of L. tristis, measured over 2θ values of 10–80°. A broad diffraction peak is observed at 23°
3.9 Bactericidal property of CDs
The CDs were found to be antibacterial against both Klebsiella pneumoniae and Staphylococcus aureus, showing better effectiveness against K. pneumoniae. Interestingly, the CDs possessed more antimicrobial activity than that of the original gland secretion (Fig. 12, Table 1).

Disc-diffusion antibacterial screening of the CDs against (a) Gram-positive Staphylococcus aureus (ATCC 33591) and (b) Gram-negative Klebsiella pneumoniae (ATCC 700603) following incubation at 35 °C for 16 h. Discs were loaded with 5 µg or 10 µg CDs, crude secretion (20 µL), tetracycline (30 µg, positive control), and distilled water (D/W, negative control)
The antibacterial potential of CDs, based on their numerous functional groups, was studied against S. aureus and K. pneumoniae bacteria. The results showed CDs have strong antibacterial potential even at low concentrations. CDs are thought to exert their potential by producing ROS when exposed to visible light, which disrupts the cell membranes and results in cell death [64]. The current research has highlighted the strong antibacterial potential of CDs using Gram-negative and positive bacteria, highlighting their potential to increase permeability, destabilize, and weaken membranes (Fig. 13). CDs of smaller sizes were also shown to have higher antibacterial potential compared to larger CDs [79]. Past research has also highlighted the fascinating antibacterial potential of CDs against different strains of bacteria, highlighting different mechanisms of action [80]. CDs synthesized from medicinal plants such as turmeric leaves using a one-step hydrothermal method were also shown to have bactericidal potential against different strains of bacteria [81]. CDs exhibit synergistic antimicrobial effects when combined with agents such as H₂O₂, enhancing bacterial inhibition at lower concentrations and potentially reducing environmental impact and the development of microbial resistance [82]. The possible mechanism of CDs against bacteria includes the production of ROS, disruption of the cell membranes of bacteria, and interaction with intracellular compounds such as DNA and enzymes. All these factors make CDs have antimicrobial potential higher than that of gland secretion [83, 84].

Schematic illustration of the proposed antibacterial activity of CDs from L. tristis secretion. The mechanism depicted is based on literature findings and was not experimentally confirmed in this work
The antimicrobial activity exhibited by the CDs could be due to various mechanisms, such as the disruption of the cell membrane of bacteria, reactions of CDs with biomolecules within the bacteria cells, and the production of reactive oxygen species (ROS). Nonetheless, the current experiment was not conducted to investigate the mechanisms involved in the antimicrobial activity. The above suggestions could therefore be regarded as possible mechanisms in accordance with literature reports.
3.10 Antioxidant activity – DPPH assay
The antioxidant activity of CDs prepared from the secretion of L. tristis was examined by the DPPH assay method. Figure 14a depicts the UV-Vis absorption spectra of DPPH with different concentrations of CDs (40 µg to 80 µg). There is a gradual decrease in the DPPH absorption at around 517 nm with an increase in the concentration of CDs. It is clear that CDs exhibit antioxidant activity by scavenging the DPPH radicals. The maximum absorption of DPPH alone was at 0.6 a.u., and there was a gradual decrease in the absorption of DPPH with an increase in the concentration of CDs (40 µg and 80 µg). Figure 14b displays the calibration curve of the radical scavenging activity (%) (S%) versus the concentration of CDs. It is clear that the activity of scavenging radicals is directly proportional to the concentration of CDs. The half maximal effective concentration (EC₅₀), the concentration of CDs at which the DPPH radical is decreased by 50%, was found to be 76.77 µg.

DPPH radical scavenging assay of the CDs. (a) Absorption spectra of 0.1 mM DPPH in methanol, measured at 517 nm after 30 min incubation in the dark with increasing amounts of CDs (40–80 µg). (b) Scavenging activity percentage (S%) as a function of CD amount. Data represent mean ± SD (n = 3). EC₅₀ = 76.77 µg
While ascorbic acid had higher antioxidant potential, CD obtained from secretion of L. tristis demonstrated concentration-dependent scavenging potential for DPPH radicals. Antioxidant ability of CDs was related to surface functional groups such as (–OH, –COOH, and –NH₂) that donated electrons or hydrogen atoms to reduce DPPH radicals [85]. CDs showed dose-dependent scavenging activity of the DPPH radicals with moderate antioxidant activity (EC₅₀ = 76.77 µg), though relatively lower when compared to ascorbic acid. The mechanism for the antioxidant activity of CDs is due to their small particle sizes and the presence of functional groups like carboxylic and hydroxyl at the surface, which enables free electron transfer [86, 87]. The antioxidant activity of CDs can be attributed to the functional groups present on the surface, especially the carboxyl and hydroxyl functional groups, which can donate electrons to the free radicals, thus scavenging them [49]. The decrease in the absorbance of the free radicals also shows the ability of CDs to disrupt the structure of the free radicals, thus converting them into their non-radical form(Fig. 15).

Diagrammatic representation of the proposed antioxidant mechanism of the CDs. The mechanism depicted is based on literature findings
The antioxidant activity of L. tristis-derived CDs is likely due to oxygen-containing surface functional groups that donate electrons or hydrogen atoms to neutralize free radicals, although the exact mechanism was not investigated. The proposed antioxidant mechanism of the CDs is depicted in Fig. 15. These findings highlight their potential as natural antioxidants for biomedical and environmental applications, warranting further mechanistic and comparative studies.
3.11 Anticancer activity
The cytotoxicity results of CDs showed a concentration-dependent increase in cell death, as shown in Table 2 and Fig. 16. At the lowest concentration (20 µg/mL), 6.54% of cells were dead, increasing to 79.1% at the highest concentration (150 µg/mL). The control tube (without any compounds) contained only 3 dead cells.
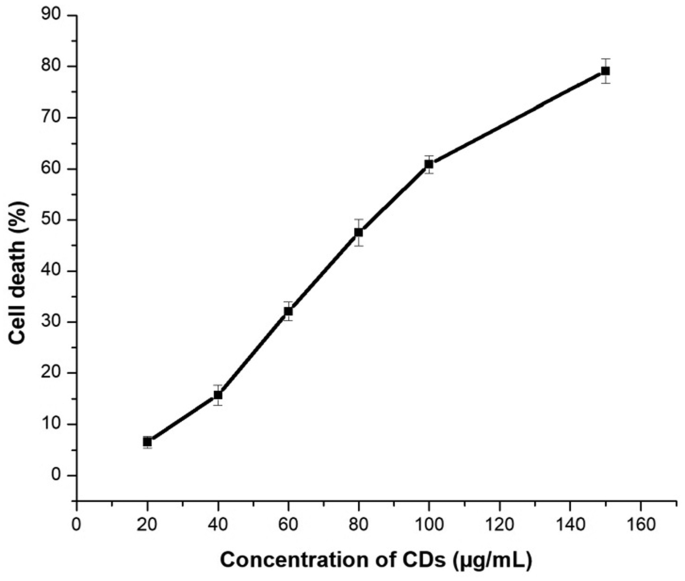
In vitro cytotoxicity of the CDs on DLA cells using the trypan blue dye exclusion test following 3 h incubation at 37 °C. Cell death ranged from 6.54% at 20 µg/mL to 79.1% at 150 µg/mL
The CDs prepared from Luprops showed considerable cytotoxic activity against DLA cells as shown in Fig. 17. The high cytotoxic activity of CDs may be due to the functional groups present on the CDs. The functional groups present on the CDs may have enhanced the cytotoxic activity of CDs. The CDs have been found to induce cytotoxicity by increasing the uptake of CDs by cancer cells. CDs demonstrated significant cytotoxicity against DLA cells in a concentration-dependent manner, with a notable increase in cell death from 6.54% at 20 µg/mL to 79.1% at 150 µg/mL. This suggests that carbon dots synthesized from L. tristis secretion exhibit potent cytotoxic activity. Compared to other CDs, which caused considerably less cytotoxicity, CDs from Luprops showed superior efficacy in inducing cell death. This high cytotoxicity could be attributed to the surface functionalization of the CDs, which enhances cellular uptake and interaction with tumor cells. The mechanism involves enhanced cellular uptake of CDs due to their nanoscale size and surface functional groups, leading to reactive oxygen species (ROS) generation, membrane disruption, and mitochondrial dysfunction. These effects trigger apoptotic pathways, causing DNA damage, protein inactivation, and loss of cell viability. Thus, CDs act as effective anticancer agents by combining oxidative stress and structural damage to induce apoptosis in tumor cells [88, 89] as given in Fig. 16. Previous studies on CDs synthesized from various natural sources also indicate low cytotoxicity at lower concentrations and increased cytotoxicity at higher concentrations [24, 47, 90]. However, the cytotoxicity of present CDs is notably higher than other reported CDs as in this study achieved over 79% cytotoxicity. This makes the CDs from L. tristis secretion particularly promising for therapeutic applications in cancer treatment, with stronger cytotoxic effects than other carbon dots produced through green synthesis.

Schematic representation of the proposed anticancer activity of the CDs on DLA cells. The mechanism depicted is based on literature findings and was not experimentally confirmed in this work
4 Conclusion
Summing up, in the present work, a simple and eco-friendly method for the synthesis of CDs by using a common species of beetles, which is a novel and eco-friendly source of CDs, has been proposed. The prepared CDs have been found to have excellent fluorescence properties for the development of bio-imaging devices, biosensors, and antibacterial agents. The CDs have been found to have moderate colloidal stability without the need for surface passivator additives. The presence of the absorption band at 225 nm is attributed to the π-π* transition of the C = C bond, as supported by the UV-Vis spectra. The presence of functional groups such as the involvement in the formation and reduction of CDs is supported by the FT-IR spectra. The presence of the D and G bands of CDs is supported by the Raman spectra. TEM analysis confirmed that the synthesized CDs were well distributed with an average particle size of 3.9 nm, demonstrating the successful formation of nanoscale CDs. The XRD results confirmed the successful formation of amorphous graphitic C-dots from L. tristis, supporting their effective green synthesis and nanocarbon structure. The presence of such excellent properties makes the CDs potential biomedical agents for the improvement of human health. In the present work, the prepared CDs have also been found to have excellent antibacterial, anticancer, and antioxidant properties. CDs have been synthesized from various eco-friendly sources, as proposed in the literature. However, the proposed eco-friendly method of synthesis of CDs from an insect is novel and innovative.
Data availability
The datasets generated and analysed during the current study are available from the corresponding author on reasonable request.
References
Mathew A, Ravindran RA, Vazhanthodi AR, et al. Microwave-assisted greener synthesis of silver nanoparticles using entada rheedii leaf extract and investigation of its anticancer and antimicrobial properties. Int J Nano Dimension. 2022;13. https://doi.org/10.22034/ijnd.2022.1952713.2126.
Ajaykumar AP, Sabira O, Sebastian M, Varma SR, Roy KB, Binitha VS, et al. A novel approach for the biosynthesis of silver nanoparticles using the defensive gland extracts of the beetle, luprops tristis Fabricius. Sci Rep. 2023;13:10186. https://doi.org/10.1038/s41598-023-37175-0.
Ajaykumar AP, Sabira O, Binitha VS, Varma SR, Mathew A, Jayaraj KN, et al. Bio-fabricated silver nanoparticles from the leaf extract of the poisonous plant, holigarna arnottiana: assessment of antimicrobial, antimitotic, anticancer, and radical-scavenging properties. Pharmaceutics. 2023;15(10):2468. https://doi.org/10.3390/pharmaceutics15102468.
Sabira O, Drisya N, Ajaykumar AP, Mathew A, Narayanan Jayaraj K, Binitha VS, et al. From ficus recemosa leaf galls to therapeutic silver nanoparticles: antibacterial and anticancer applications. Pharmaceutics. 2024;16(8):1025. https://doi.org/10.3390/pharmaceutics16081025.
Sabira O, Ajaykumar AP, Varma SR, Jayaraj KN, Kotakonda M, Kumar P, et al. Nepenthes pitcher fluid for the green synthesis of silver nanoparticles with biofilm inhibition, anticancer and antioxidant properties. Sci Rep. 2025;15(1):5349. https://doi.org/10.1038/s41598-025-89212-9.
Sun YP, Zhou B, Lin Y, Wang W, Fernando KAS, Pathak P, et al. Quantum-sized carbon dots for bright and colorful photoluminescence. J Am Chem Soc [Internet]. 2006, Jun, 1;128(24):7756–57. Available from: https://doi.org/10.1021/ja062677d. 2024 Apr 26.
Baker SN, Baker GA. Luminescent carbon nanodots: emergent nanolights. Angew Chem Int Ed [Internet]. 2010;49(38):6726–44. Available from: https://onlinelibrary.wiley.com/doi/abs/10.1002/anie.200906623. 2024 Apr 26.
Li H, Kang Z, Liu Y, Lee ST. Carbon nanodots: synthesis, properties and applications. J Mater Chem [Internet]. 2012, Nov, 6;22(46):24230–53. Available from: https://doi.org/10.1039/c2jm34690g. https://pubs.rsc.org/en/content/articlelanding/2012/jm/c2jm34690g. 2024 Apr 26.
Bhunia SK, Saha A, Maity AR, Ray SC, Jana NR. Carbon Nanoparticle-based fluorescent bioimaging probes. Sci Rep [Internet]. 2013, Mar, 18;3(1):1473. Available from: https://doi.org/10.1038/srep01473. https://www.nature.com/articles/srep01473. 2024 Apr 23.
Khayal A, Dawane V, Amin MA, Tirth V, Yadav VK, Algahtani A, et al. Advances in the methods for the synthesis of carbon dots and their emerging applications. Polymers [Internet]. 2021, Jan;13(18):3190. Available from: 10.3390/polym13183190. 2024 Apr 26.
Xu X, Ray R, Gu Y, Ploehn HJ, Gearheart L, Raker K, et al. Electrophoretic analysis and purification of fluorescent single-walled carbon nanotube fragments. J Am Chem Soc [Internet]. 2004, Oct, 1;126(40):12736–37. Available from: https://doi.org/10.1021/ja040082h. 2024 Jun 24.
Zhao QL, Zhang ZL, Huang BH, Peng J, Zhang M, Pang DW. Facile preparation of low cytotoxicity fluorescent carbon nanocrystals by electrooxidation of graphite. Chem Commun [Internet]. 2008, Oct, 27;(41):5116–18. Available from: https://doi.org/10.1039/b812420e. https://pubs.rsc.org/en/content/articlelanding/2008/cc/b812420e. 2024 Jun 24];.
Hu SL, Niu KY, Sun J, Yang J, Zhao NQ, Du XW. One-step synthesis of fluorescent carbon nanoparticles by laser irradiation. J Mater Chem [Internet]. 2009, Jan, 13;19(4):484–88. Available from: https://doi.org/10.1039/B812943F. https://pubs.rsc.org/en/content/articlelanding/2009/jm/b812943f. 2024 Jun 24.
Tan D, Zhou S, Qiu J. Comment on “upconversion and downconversion fluorescent graphene quantum dots: ultrasonic preparation and photocatalysis”. ACS Nano [Internet]. 2012, Aug, 28;6(8):6530–31. Available from: https://doi.org/10.1021/nn3016822. 2024 Jun 24.
Bao R, Chen Z, Zhao Z, Sun X, Zhang J, Hou L, et al. Green and facile synthesis of nitrogen and Phosphorus Co-doped carbon quantum Dots towards fluorescent ink and sensing applications. Nanomaterials [Internet]. 2018, Jun;8(6):386. Available from: https://www.mdpi.com/2079-4991/8/6/386. 2024 Jun 24.
Yadav PK, Chandra S, Kumar V, Kumar D, Hasan SH. Carbon quantum dots: synthesis, structure, properties, and catalytic applications for organic synthesis. Catalysts [Internet]. 2023, Feb;13(2):422. Available from: https://doi.org/10.3390/catal13020422. 2024 Jun 24.
Shi J, Ni G, Tu J, Jin X, Peng J. Green synthesis of fluorescent carbon dots for sensitive detection of Fe2+ and hydrogen peroxide. J Nanopart Res [Internet]. 2017, Jun, 7;19(6):209. Available from: https://doi.org/10.1007/s11051-017-3888-5. 2024 Jun 24.
Liu W, Diao H, Chang H, Wang H, Li T, Wei W. Green synthesis of carbon dots from rose-heart radish and application for Fe3+ detection and cell imaging. Sens Actuators B Chem [Internet]. 2017, Mar, 31;241:190–98. Available from: https://doi.org/10.1016/j.snb.2016.10.068. https://www.sciencedirect.com/science/article/pii/S092540051631694X. 2024 Jun 24.
Kumar A, Chowdhuri AR, Laha D, Mahto TK, Karmakar P, Sahu SK. Green synthesis of carbon dots from Ocimum sanctum for effective fluorescent sensing of Pb2+ ions and live cell imaging. Sens Actuators B Chem [Internet]. 2017, Apr, 1;242:679–86. Available from: https://doi.org/10.1016/j.snb.2016.11.109. https://www.sciencedirect.com/science/article/pii/S0925400516319074. 2024 Jun 21.
Huang H, Lv JJ, Zhou DL, Bao N, Xu Y, Wang AJ, et al. One-pot green synthesis of nitrogen-doped carbon nanoparticles as fluorescent probes for mercury ions. RSC Adv [Internet]. 2013, Oct, 21;3(44):21691–96. Available from: https://pubs.rsc.org/en/content/articlelanding/2013/ra/c3ra43452d. 2024 Jun 24.
Bhatt S, Bhatt M, Kumar A, Vyas G, Gajaria T, Paul P. Green route for synthesis of multifunctional fluorescent carbon dots from Tulsi leaves and its application as Cr(VI) sensors, bio-imaging and patterning agents. Colloids Surf, B [Internet]. 2018, Jul, 1;167:126–33. Available from: Available from: https://doi.org/10.1016/j.colsurfb.2018.04.008. https://www.sciencedirect.com/science/article/pii/S0927776518302121. 2024 Jun 24.
Bano D, Kumar V, Singh VK, Hasan SH. Green synthesis of fluorescent carbon quantum dots for the detection of mercury(II) and glutathione. New J Chem [Internet]. 2018, Apr, 16;42(8):5814–21. Available from: https://doi.org/10.1039/C8NJ00432C. https://pubs.rsc.org/en/content/articlelanding/2018/nj/c8nj00432c. 2024 Jun 24.
Wan Y, Wang M, Zhang K, Fu Q, Gao M, Wang L, et al. Facile and green synthesis of fluorescent carbon dots from the flowers of abelmoschus manihot (Linn.) Medicus for sensitive detection of 2, 4, 6-trinitrophenol and cellular imaging. Microchem J [Internet]. 2019, Jul, 1;148:385–96. Available from: https://doi.org/10.1016/j.microc.2019.05.026. https://www.sciencedirect.com/science/article/pii/S0026265X19308495. 2024 Jun 24.
Arkan E, Barati A, Rahmanpanah M, Hosseinzadeh L, Moradi S, Hajialyani M. Green synthesis of carbon dots derived from walnut oil and an investigation of their cytotoxic and apoptogenic activities toward cancer cells. Adv Pharm Bull. 2018, Mar;8(1):149–55. https://doi.org/10.15171/apb.2018.018.
Zhou J, Sheng Z, Han H, Zou M, Li C. Facile synthesis of fluorescent carbon dots using watermelon peel as a carbon source. Mater Lett: X [Internet]. 2012, Jan, 1;66(1):222–24. Available from: https://doi.org/10.1016/j.matlet.2011.08.081. https://www.sciencedirect.com/science/article/pii/S0167577X11009840. 2024 Jun 24.
Gu D, Shang S, Yu Q, Shen J. Green synthesis of nitrogen-doped carbon dots from lotus root for Hg(II) ions detection and cell imaging. Appl Surf Sci [Internet]. 2016, Dec, 30;390:38–42. Available from: https://doi.org/10.1016/j.apsusc.2016.08.012. https://www.sciencedirect.com/science/article/pii/S0169433216316543. 2024 Jun 24.
Yang K, Liu M, Wang Y, Wang S, Miao H, Yang L, et al. Carbon dots derived from fungus for sensing hyaluronic acid and hyaluronidase. Sens Actuators B Chem [Internet]. 2017, Nov, 1;251:503–08. Available from: https://doi.org/10.1016/j.snb.2017.05.086. https://www.sciencedirect.com/science/article/pii/S0925400517309097. 2024 Jun 24.
Tao H, Yang K, Ma Z, Wan J, Zhang Y, Kang Z, et al. In vivo NIR fluorescence imaging, biodistribution, and toxicology of photoluminescent carbon dots produced from carbon nanotubes and graphite. Small [Internet]. 2012;8(2):281–90. Available from: https://doi.org/10.1002/smll.201101706. 2024 Apr 26.
Liu Q, Xu S, Niu C, Li M, He D, Lu Z, et al. Distinguish cancer cells based on targeting turn-on fluorescence imaging by folate functionalized green emitting carbon dots. Biosens Bioelectron [Internet]. 2015, Feb, 15;64:119–25. Available from: https://doi.org/10.1016/j.bios.2014.08.052. https://www.sciencedirect.com/science/article/pii/S0956566314006484. 2024 Apr 23.
Zhang J, Zhao X, Xian M, Dong C, Shuang S. Folic acid-conjugated green luminescent carbon dots as a nanoprobe for identifying folate receptor-positive cancer cells. Talanta [Internet]. 2018, Jun, 1;183(1):39–47. Available from: https://doi.org/10.1016/j.talanta.2018.02.009. https://www.sciencedirect.com/science/article/pii/S003991401830122X. 2024 Apr 23.
Zhou L, Lin Y, Huang Z, Ren J, Qu X. Carbon nanodots as fluorescence probes for rapid, sensitive, and label-free detection of Hg2+ and biothiols in complex matrices. Chem Commun [Internet]. 2012, Jan, 4;48(8):1147–49. Available from: https://doi.org/10.1039/C2CC16791C. https://pubs.rsc.org/en/content/articlelanding/2012/cc/c2cc16791c. 2024 Apr 23.
Qu K, Wang J, Ren J, Qu X. Carbon dots prepared by hydrothermal treatment of dopamine as an effective fluorescent sensing platform for the label-free detection of Iron(III) ions and dopamine. Chem - Eur J [Internet]. 2013;19(22):7243–49. Available from: https://onlinelibrary.wiley.com/doi/abs/10.1002/chem.201300042. 2024 Apr 23.
Maiti S, Das K, Das PK. Label-free fluorimetric detection of histone using quaternized carbon dot-DNA nanobiohybrid. Chem Commun [Internet]. 2013, Sep, 5;49(78):8851–53. Available from: https://pubs.rsc.org/en/content/articlelanding/2013/cc/c3cc44492a. 2024 Apr 23.
Choi CA, Lee JE, Mazrad ZAI, Kim YK, In I, Jeong JH, et al. Dual-responsive carbon Dot for pH/Redox-triggered fluorescence imaging with controllable photothermal ablation therapy of cancer. ChemMedchem [Internet]. 2018;13(14):1459–68. Available from: 10.1002/cmdc.201800202. 2024 Apr 23.
Wang H, Sun Y, Yi J, Fu J, Di J, Del Carmen Alonso A, et al. Fluorescent porous carbon nanocapsules for two-photon imaging, NIR/pH dual-responsive drug carrier, and photothermal therapy. Biomaterials [Internet]. 2015, Jun, 1;53(1):117–26. Available from: https://doi.org/10.1016/j.biomaterials.2015.02.087. https://www.sciencedirect.com/science/article/pii/S0142961215002173. 2024 Apr 23.
Sarkar N, Sahoo G, Das R, Prusty G, Swain SK. Carbon quantum dot tailored calcium alginate hydrogel for pH responsive controlled delivery of vancomycin. Eur J Pharm Sci [Internet]. 2017, Nov, 15;109:359–71. Available from: https://doi.org/10.1016/j.ejps.2017.08.015. https://www.sciencedirect.com/science/article/pii/S0928098717304591. 2024 Apr 23.
Anugraha SN, Sabira O, Ajaykumar AP, Reshmi CP, Leeja L, Nataraj D, et al. Biocompatible carbon dots from fermented and non-fermented coconut water: evaluation of antioxidant, antimitotic, antibacterial and cytotoxic activities. Bioresource Technol Rep. 2025;30:102176. https://doi.org/10.1016/j.biteb.2025.102176.
Mewada A, Pandey S, Shinde S, Mishra N, Oza G, Thakur M, et al. Green synthesis of biocompatible carbon dots using aqueous extract of trapa bispinosa peel. Mater Sci Eng: C [Internet]. 2013, Jul, 1;33(5):2914–17. Available from: https://doi.org/10.1016/j.msec.2013.03.018. https://www.sciencedirect.com/science/article/pii/S092849311300180X. 2024 Apr 26.
Arul V, Edison TNJI, Lee YR, Sethuraman MG. Biological and catalytic applications of green synthesized fluorescent N-doped carbon dots using hylocereus undatus. J Photochemistry Photobiol B: Biol [Internet]. 2017, Mar, 1;168(1):142–48. Available from: https://doi.org/10.1016/j.jphotobiol.2017.02.007. https://www.sciencedirect.com/science/article/pii/S101113441730057X. 2024 Apr 26.
Komalavalli L, Amutha P, Monisha S. A facile approach for the synthesis of carbon dots from hibiscus sabdariffa & its application as bio-imaging agent and Cr (VI) sensor. Mater Today: Proc [Internet]. 2020, Jan, 1;33(1):2279–85. Available from: https://doi.org/10.1016/j.matpr.2020.04.195. https://www.sciencedirect.com/science/article/pii/S2214785320328108. 2024 Apr 26.
Ajaykumar AP, Mathew A, Chandni AP, et al. Green synthesis of silver nanoparticles using the leaf extract of the medicinal plant, Uvaria narum and its antibacterial, antiangiogenic, anticancer and catalytic properties. Antibiotics. 2023;12:564. https://doi.org/10.3390/antibiotics12030564.
Ajaykumar AP, Nikhila K, Sabira O, et al. A bio-inspired approach for the synthesis of few-layer graphene using beetle defensive gland extract. RSC Adv. 2024;14:5729–39.
Sabira O, Parambil AA. Bio-synthesis of copper oxide nanoparticles using beetle defensive gland extract: exploring diverse applications. Int J Nano. 2024;15(3). https://doi.org/10.57647/j.ijnd.2024.1503.21.
Sabira O, Ajaykumar AP. Harnessing luprops tristis for gold nanoparticle synthesis and its remarkable biological uses. Next Nanotechnol. 2025;8:100265. https://doi.org/10.1016/j.nxnano.2025.100265.
Sabira O, Ajaykumar AP. Biogenic ZnO nanoparticles derived from the luprops tristis beetle exhibit broad spectrum activity, including DPPH radical scavenging, antibacterial, anticancer effects, and sensitive glucose detection. Next Mater. 2026;11:101940. https://doi.org/10.1016/j.nxmate.2026.101940.
Sabira O, Vignesh AR, Ajaykumar AP, Varma SR, Jayaraj KN, Sebastin M, et al. The chemical composition and antimitotic, antioxidant, antibacterial and cytotoxic properties of the defensive gland extract of the beetle, luprops tristis Fabricius. Molecules [Internet]. 2022, Jan;27(21):7476. Available from: 10.3390/molecules27217476. 2023 Jan 12.
Chahal S, Macairan JR, Yousefi N, Tufenkji N, Naccache R. Green synthesis of carbon dots and their applications. RSC Adv [Internet]. 2021;11(41):25354–63. Available from: https://doi.org/10.1039/D1RA04718C. https://pubs.rsc.org/en/content/articlelanding/2021/ra/d1ra04718c. 2024 Jun 20.
Madar I, Sultan G, Chelliah R, Oh DH. Screening for anticancer activity: trypan blue exclusion assay. In: Dharumadurai D, editor. Methods in actinobacteriology [internet]. Springer Protocols Handbooks. New York, NY: Humana; 2022. p. 443–48. Available from: 2024 Sep 26. https://link.springer.com/protocol/10.1007/978-1-0716-1728-1_59.
Peng Y, Wang ZG, Qi BP, Liu C, Tang B, Zhang ZL, et al. Carboxyl groups on carbon nanodots as co-reactant sites for anodic electrochemiluminescence of tris(2, 2-bipyridine)ruthenium(II). J Colloid Interface Sci [Internet]. 2024, Jan, 1;653:1256–63. Available from: https://doi.org/10.1016/j.jcis.2023.09.122. https://www.sciencedirect.com/science/article/pii/S0021979723018234. 2024 Jul 5.
Zaib M, Arshad A, Khalid S, Shahzadi T. One pot ultrasonic plant mediated green synthesis of carbon dots and their application invisible light induced dye photocatalytic studies: a kinetic approach. Int J Environ Analytical Chem [Internet]. 2023, Dec, 20;103(17):5063–81. Available from: https://doi.org/10.1080/03067319.2021.1934463. 2024 Jun 20.
Atchudan R, Edison TNJI, Sethuraman MG, Lee YR. Efficient synthesis of highly fluorescent nitrogen-doped carbon dots for cell imaging using unripe fruit extract of prunus mume. Appl Surf Sci [Internet]. 2016, Oct, 30;384:432–41. Available from: https://doi.org/10.1016/j.apsusc.2016.05.054. https://www.sciencedirect.com/science/article/pii/S0169433216310625. 2024 Jun 20.
Gaddam RR, Mukherjee S, Punugupati N, Vasudevan D, Patra CR, Narayan R, et al. Facile synthesis of carbon dot and residual carbon nanobeads: implications for ion sensing, medicinal and biological applications. Mater Sci Eng: C [Internet]. 2017, Apr, 1;73(1):643–52. Available from: https://doi.org/10.1016/j.msec.2016.12.095. https://www.sciencedirect.com/science/article/pii/S0928493116311146. 2024 Jun 20.
Zuo P, Lu X, Sun Z, Guo Y, He H. A review on syntheses, properties, characterization and bioanalytical applications of fluorescent carbon dots. Microchim Acta [Internet]. 2016, Feb, 1;183(2):519–42. Available from: https://doi.org/10.1007/s00604-015-1705-3. 2024 Jun 20.
Hinterstoisser B, Salmén L. Two-dimensional step-scan FTIR: a tool to unravel the OH-valency-range of the spectrum of cellulose I. Cellulose [Internet]. 1999, Sep, 1;6(3):251–63. Available from: https://doi.org/10.1023/A:1009225815913. 2024 Jun 20.
Jia N, Li SM, Ma MG, Zhu J, Sun RC. Synthesis and characterization of cellulose-silica composite fiber in ethanol/water mixed solvents. Bioresources. 2011, Feb, 23;6(2):1186–95. https://doi.org/10.15376/biores.6.2.1186-1195.
Oh SY, Yoo DI, Shin Y, Seo G. FTIR analysis of cellulose treated with sodium hydroxide and carbon dioxide. Carbohydr Res [Internet]. 2005, Feb, 28;340(3):417–28. Available from: https://doi.org/10.1016/j.carres.2004.11.027. https://www.sciencedirect.com/science/article/pii/S0008621504005117. 2024 Jun 20.
Yan W, Zhang J, Jing C. Adsorption of Enrofloxacin on montmorillonite: two-dimensional correlation ATR/FTIR spectroscopy study. J Colloid Interface Sci [Internet]. 2013, Jan, 15;390(1):196–203. Available from: https://doi.org/10.1016/j.jcis.2012.09.039. https://www.sciencedirect.com/science/article/pii/S0021979712010636. 2024 Jun 20.
Pandey KK, Pitman AJ. FTIR studies of the changes in wood chemistry following decay by brown-rot and white-rot fungi. Int Biodeterior Biodegrad [Internet]. 2003, Oct, 1;52(3):151–60. Available from: https://doi.org/10.1016/S0964-8305(03)00052-0. https://www.sciencedirect.com/science/article/pii/S0964830503000520. 2024 Jun 20.
Sim LC, Tai JY, Khor JM, Wong JL, Lee JY, Leong KH, et al. Carbon dots synthesized from green precursors with an amplified photoluminescence: synthesis, characterization, and its application. In: Prasad R, editor. Plant nanobionics: volume 2, approaches in Nanoparticles, biosynthesis, and toxicity [internet]. Cham: Springer International Publishing; 2019. p. 1–33. Available from: 2024 Jun 20: https://doi.org/10.1007/978-3-030-16379-2_1.
Li Z, Deng L, Kinloch IA, Young RJ. Raman spectroscopy of carbon materials and their composites: Graphene, nanotubes and fibres. Prog Mater Sci [Internet]. 2023, Jun, 1;135:101089. Available from: https://doi.org/10.1016/j.pmatsci.2023.101089. https://www.sciencedirect.com/science/article/pii/S007964252300021X. 2024 Jul 5.
Brosseau CL, Colina A, Perales-Rondon JV, Wilson AJ, Joshi PB, Ren B, et al. Electrochemical surface-enhanced raman spectroscopy. Nat Rev Methods Primers [Internet]. 2023 Oct 26 [2024 Jul 5]. 3(1):1–21. Available from: https://doi.org/10.1038/s43586-023-00263-6. https://www.nature.com/articles/s43586-023-00263-6.
Shahshahanipour M, Rezaei B, Ensafi AA, Etemadifar Z. An ancient plant for the synthesis of a novel carbon dot and its applications as an antibacterial agent and probe for sensing of an anti-cancer drug. Mater Sci Eng: C [Internet]. 2019, May, 1;98:826–33. Available from: https://doi.org/10.1016/j.msec.2019.01.041. https://www.sciencedirect.com/science/article/pii/S0928493118314991. 2024 Jun 21.
Zulfajri M, Gedda G, Chang CJ, Chang YP, Huang GG. Cranberry beans derived carbon dots as a potential fluorescence sensor for selective detection of Fe3+ ions in aqueous solution. ACS Omega [Internet]. 2019, Sep, 24;4(13):15382–92. Available from: https://doi.org/10.1021/acsomega.9b01333. 2024 Jun 13.
Mehta VN, Jha S, Kailasa SK. One-pot green synthesis of carbon dots by using saccharum officinarum juice for fluorescent imaging of bacteria (Escherichia coli) and yeast (Saccharomyces cerevisiae) cells. Mater Sci Eng: C [Internet]. 2014, May, 1;38:20–27. Available from: https://doi.org/10.1016/j.msec.2014.01.038. https://www.sciencedirect.com/science/article/pii/S0928493114000460. 2024 Jun 13.
Huo X, He Y, Ma S, Jia Y, Yu J, Li Y, et al. Green synthesis of carbon Dots from Grapefruit and its fluorescence enhancement. J Nanomater [Internet]. 2020;2020(1):8601307. Available from: https://onlinelibrary.wiley.com/doi/abs/10.1155/2020/8601307. 2024 Jun 20.
Long R, Tang C, Li T, Tong X, Tong C, Guo Y, et al. Dual-emissive carbon dots for dual-channel ratiometric fluorometric determination of pH and mercury ion and intracellular imaging. Microchim Acta [Internet]. 2020, May, 1;187(5):307. Available from: https://doi.org/10.1007/s00604-020-04287-7. 2024 Jul 5.
Sun Y, Wang Q, Liu J, Zhao Z, Li L, Liu Z, et al. Ratiometric sensing of intracellular pH based on dual emissive carbon dots. J Fluoresc [Internet]. 2023, Mar, 1;33(2):653–61. Available from: https://doi.org/10.1007/s10895-022-03107-w. 2024 Jul 5.
Sahu S, Behera B, Maiti TK, Mohapatra S. Simple one-step synthesis of highly luminescent carbon dots from orange juice: application as excellent bio-imaging agents. Chem Commun [Internet]. 2012, Aug, 6;48(70):8835–37. Available from: https://doi.org/10.1039/c2cc33796g. https://pubs.rsc.org/en/content/articlelanding/2012/cc/c2cc33796g. 2024 Jun 20.
Dinç S. A simple and green extraction of carbon dots from sugar beet molasses: biosensor applications. Zuckerindustrie Sugar Ind. 2016, Sep, 1;560–64. https://doi.org/10.36961/si17741.
Bajpai SK, D’souza A, Suhail B. Carbon dots from Guar Gum: synthesis, characterization and preliminary in vivo application in plant cells. Mater Sci Eng: B [Internet]. 2019, Feb, 1;241:92–99. Available from: https://doi.org/10.1016/j.mseb.2019.02.014. https://www.sciencedirect.com/science/article/pii/S0921510719300480. 2024 Jun 21.
Tenkayala NK, Katari NK, Gundla R, Jonnalagadda SB, Devaraju S. Sustainable approach to synthesis of carbon dot/ silver nanoparticles for biological evaluation as antimicrobial agent. Mater Res Express [Internet]. 2024, Jan;11(1):015005. Available from: https://doi.org/10.1088/2053-1591/ad1128. 2024 Jun 21.
Tan M, Zhang L, Tang R, Song X, Li Y, Wu H, et al. Enhanced photoluminescence and characterization of multicolor carbon dots using plant soot as a carbon source. Talanta [Internet]. 2013, Oct, 15;115:950–56. Available from: https://doi.org/10.1016/j.talanta.2013.06.061. https://www.sciencedirect.com/science/article/pii/S0039914013005614. 2024 Jun 21.
Ma X, Dong Y, Sun H, Chen N. Highly fluorescent carbon dots from peanut shells as potential probes for copper ion: the optimization and analysis of the synthetic process. Mater Today Chem [Internet]. 2017, Sep, 1;5:1–10. Available from: https://doi.org/10.1016/j.mtchem.2017.04.004. https://www.sciencedirect.com/science/article/pii/S2468519417300745. 2024 Jun 21.
Prathap N, Balla P, Shivakumar MS, Periyasami G, Karuppiah P, Ramasamy K, et al. Prosopis juliflora hydrothermal synthesis of high fluorescent carbon dots and its antibacterial and bioimaging applications. Sci Rep [Internet]. 2023, Jun, 15;13(1):9676. Available from: https://doi.org/10.1038/s41598-023-36033-3. https://www.nature.com/articles/s41598-023-36033-3. 2024 Jun 21.
Liao X, Chen C, Zhou R, Huang Q, Liang Q, Huang Z, et al. Comparison of N-doped carbon dots synthesized from the main components of plants including cellulose, lignin, and xylose: characterized, fluorescence mechanism, and potential applications. Dyes Pigm [Internet]. 2020, Dec, 1;183:108725. Available from: https://doi.org/10.1016/j.dyepig.2020.108725. https://www.sciencedirect.com/science/article/pii/S0143720820314224. 2024 Jun 21.
Pal T, Mohiyuddin S, Packirisamy G. Facile and green synthesis of multicolor fluorescence carbon dots from curcumin: in vitro and in vivo bioimaging and other applications. ACS Omega [Internet]. 2018, Jan, 31;3(1):831–43. Available from: https://doi.org/10.1021/acsomega.7b01323. 2024 Jun 20.
Jiang D, Chen Y, Li N, Li W, Wang Z, Zhu J, et al. Synthesis of luminescent Graphene quantum Dots with high quantum yield and their toxicity study. PLoS One [Internet]. 2015, Dec, 28;10(12):e0144906. Available from: 10.1371/journal.pone.0144906. 2024 Jun 20.
Gedda G, Sankaranarayanan SA, Putta CL, Gudimella KK, Rengan AK, Girma WM. Green synthesis of multi-functional carbon dots from medicinal plant leaves for antimicrobial, antioxidant, and bioimaging applications. Sci Rep [Internet]. 2023, Apr, 19;13(1):6371. Available from: https://doi.org/10.1038/s41598-023-33652-8. https://www.nature.com/articles/s41598-023-33652-8. 2024 Jun 21.
Sun B, Wu F, Zhang Q, Chu X, Wang Z, Huang X, et al. Insight into the effect of particle size distribution differences on the antibacterial activity of carbon dots. J Colloid Interface Sci [Internet]. 2021, Feb, 15;584:505–19. Available from: https://doi.org/10.1016/j.jcis.2020.10.015. https://www.sciencedirect.com/science/article/pii/S0021979720313382. 2024 Jun 20.
Liang J, Li W, Chen J, Huang X, Liu Y, Zhang X, et al. Antibacterial activity and synergetic mechanism of carbon Dots against gram-positive and -negative bacteria. ACS Appl Bio Mater [Internet]. 2021, Sep, 20;4(9):6937–45. Available from: https://doi.org/10.1021/acsabm.1c00618. 2024 Jun 20.
Saravanan A, Maruthapandi M, Das P, Luong JHT, Gedanken A. Green synthesis of multifunctional carbon dots with antibacterial activities. Nanomaterials [Internet]. 2021, Feb;11(2):369. Available from: https://doi.org/10.3390/nano11020369. 2024 Jun 20.
Dong X, Awak MA, Tomlinson N, Tang Y, Sun YP, Yang L. Antibacterial effects of carbon dots in combination with other antimicrobial reagents. PLoS One [Internet]. 2017, Sep, 21;12(9):e0185324. Available from: https://doi.org/10.1371/journal.pone.0185324. 2024 Jun 20.
Varghese M, Balachandran M. Antibacterial efficiency of carbon dots against gram-positive and gram-negative bacteria: a review. J Environ Chem Eng. 2021, Dec, 1;9(6):106821. https://doi.org/10.1016/j.jece.2021.106821.
Guo B, Liu G, Hu C, Lei B, Liu Y. The structural characteristics and mechanisms of antimicrobial carbon dots: a mini review. Mater Adv. 2022;3(21):7726–41. https://doi.org/10.1039/D2MA00625A.
Kedare SB, Singh RP. Genesis and development of DPPH method of antioxidant assay. J Food Sci Technol. 2011, Aug;48(4):412–22. https://doi.org/10.1007/s13197-011-0251-1.
Çeşme M, Eskalen H, Başkaya SK. Fluorescent carbon dots from Vegetable and fruit Wastes and their applications. In: Ray RC, editor. Fruits and vegetable wastes: valorization to bioproducts and platform chemicals [internet]. Singapore: Springer Nature; 2022. p. 365–83. Available from: 2024 Sep 25: https://doi.org/10.1007/978-981-16-9527-8_15.
Tsai HW, Wu T, Hsieh CL, Fu SF, Wu MY, Lin YW. Green synthesis of gardenia seeds-based carbon dots for bacterial imaging and antioxidant activity in aqueous and oil samples. RSC Adv [Internet]. 2023;13(42):29283–90. Available from: https://doi.org/10.1039/D3RA06293G. https://pubs.rsc.org/en/content/articlelanding/2023/ra/d3ra06293g. 2024 Sep 25.
Bhattacharya T, Shin GH, Kim JT. Carbon dots: opportunities and challenges in cancer therapy. Pharmaceutics. 2023, Mar, 22;15(3):1019. https://doi.org/10.3390/pharmaceutics15031019.
Pandey VK, Tripathi A, Taufeeq A, Dar AH, Samrot AV, Rustagi S, et al. Significance and applications of carbon dots in anti cancerous nanodrug conjugate development: a review. Appl Surf Sci Adv. 2024, Feb, 1;19:100550. https://doi.org/10.1016/j.apsadv.2023.100550.
Vasimalai N, Vilas-Boas V, Gallo J, de F CM, Menéndez-Miranda M, Costa-Fernández JM, et al. Green synthesis of fluorescent carbon dots from spices for in vitro imaging and tumour cell growth inhibition. Beilstein J Nanotechnol [Internet]. 2018, Feb, 13;9(1):530–44. Available from: https://www.beilstein-journals.org/bjnano/articles/9/51. 2024 Sep 26.
Acknowledgements
The first author, Sabira. O, gratefully acknowledges the financial support provided by the Council of Scientific and Industrial Research, New Delhi, India, which was instrumental in the successful completion of this research article. We extend our sincere thanks to STIC CUSAT Cochin, India for TEM analysis, CSIF - University of Calicut, India for SEM analysis,and Amala Cancer Research Centre, Thrissur, India for anticancer study.
Funding
This research was financially supported by the Council of Scientific and Industrial Research (CSIR), Government of India. The funding agency had no role in the study design, data collection and analysis, interpretation of results, manuscript preparation, or the decision to submit the article for publication.
Author information
Authors and Affiliations
Contributions
Author contributions: Conceptualization: APA, OS; Methodology: APA, OS, SG; Investigation: OS, SG; Writing – review & editing: APA, OS, SG; Supervision: APA. All authors read and approved the final manuscript.
Corresponding author
Ethics declarations
Ethical approval
This article does not contain any studies involving human participants performed by any of the authors. The experimental procedures involving insects were carried out following institutional ethical guidelines and with minimal harm to the organisms.
Consent to participate
Not applicable.
Consent to publish
Not applicable.
AI usage statement
AI-assisted tools were not used for data analysis but were employed for minor language refinement during manuscript preparation.
Competing interest
The authors declare no competing interests.
Additional information
Publisher’s Note
Springer Nature remains neutral with regard to jurisdictional claims in published maps and institutional affiliations.
Rights and permissions
Open Access This article is licensed under a Creative Commons Attribution-NonCommercial-NoDerivatives 4.0 International License, which permits any non-commercial use, sharing, distribution and reproduction in any medium or format, as long as you give appropriate credit to the original author(s) and the source, provide a link to the Creative Commons licence, and indicate if you modified the licensed material. You do not have permission under this licence to share adapted material derived from this article or parts of it. The images or other third party material in this article are included in the article’s Creative Commons licence, unless indicated otherwise in a credit line to the material. If material is not included in the article’s Creative Commons licence and your intended use is not permitted by statutory regulation or exceeds the permitted use, you will need to obtain permission directly from the copyright holder. To view a copy of this licence, visit http://creativecommons.org/licenses/by-nc-nd/4.0/.
About this article

Cite this article
Sabira, O., Ajaykumar, A.P. & A. P., S. Green synthesis of carbon dots from the defensive secretion of Luprops tristis for biomedical applications. Discov. Green Chem. 1, 38 (2026). https://doi.org/10.1007/s44509-026-00040-0
Received:
Revised:
Accepted:
Published:
Version of record:
DOI: https://doi.org/10.1007/s44509-026-00040-0